Figures & data
Table 1 Characteristics of COPD Patients and Control Subjects
Table 2 Primers for qRT-PCR
Figure 1 IL-36 was highly expressed in patients with COPD and was related to the severity of COPD. The levels of the IL-36α (A), IL-36β (B), and IL-36γ (C) in the serum of patients with COPD were measured using the ELISA kit. The number of samples in each group was as follows, GOLD 1 (n = 6), GOLD 2 (n = 20), GOLD 3 (n = 20), GOLD 4 (n=9), Control (n = 15). Data were pooled from at least 3 independent experiments and are presented as the mean ±SD. *p < 0.05, **p < 0.01.
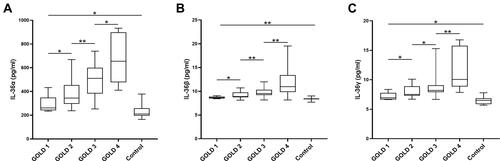
Figure 2 IL-36 was highly expressed in patients with COPD and was related to the severity of COPD. The mRNA levels and significant differences in IL-36α (A), IL-36β (B), and IL-36γ (C) in PBMCs of patients with COPD were determined by PCR. The number of samples in each group was as follows, GOLD 1 (n = 6), GOLD 2 (n = 20), GOLD 3 (n = 20), GOLD 4 (n=9), Control (n = 15). Data were pooled from at least 3 independent experiments and are presented as the mean ±SD. *p < 0.05, **p < 0.01.
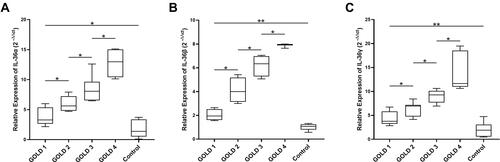
Figure 3 In COPD, IL-36 was closely related to neutrophils. (A–C) Correlation analysis of IL-36 and neutrophils in the COPD group. (D–F) Correlation analysis of IL-36 and eosinophils in the COPD group. (G–I) Correlation analysis of IL-36 and the lung functions in the COPD group.
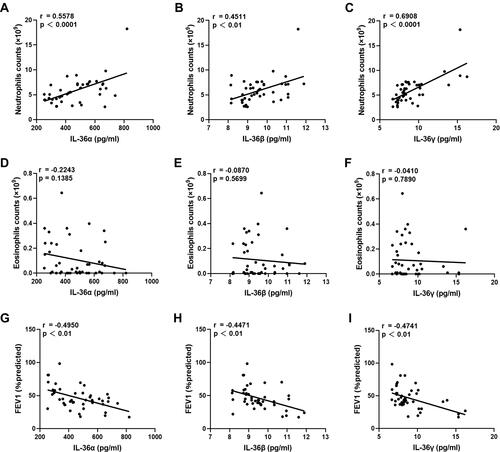
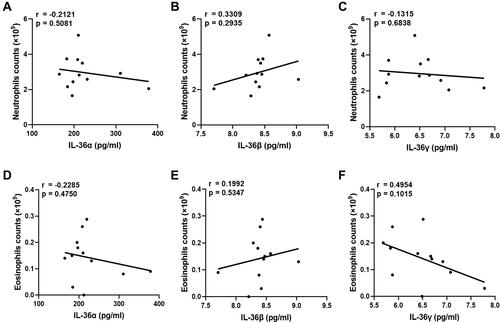
Figure 4 For control subjects, the IL-36 levels were not related to the number of inflammatory cells. (A–C) Correlation analysis of IL-36 and neutrophils in the control group. (D–F) Correlation analysis of IL-36 and eosinophils in the control group.