Figures & data
Figure 1 Study design for (A) the main analysis and (B) the sensitivity analysis.
Abbreviations: LABA, long-acting β2-agonist; LAMA, long-acting muscarinic antagonist.
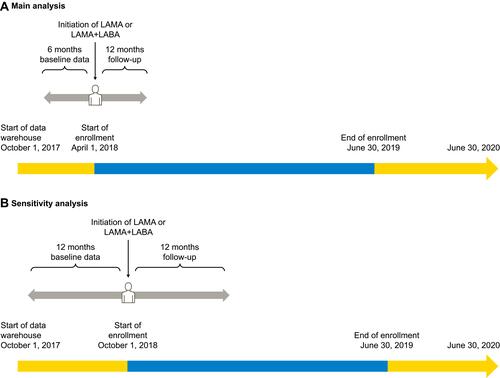
Figure 2 Patient enrollment in (A) the main analysis and (B) the sensitivity analysis.
Abbreviations: CGH, Changi General Hospital; COPD, chronic obstructive pulmonary disease; LABA, long-acting β2-agonist; LAMA, long-acting muscarinic antagonist.
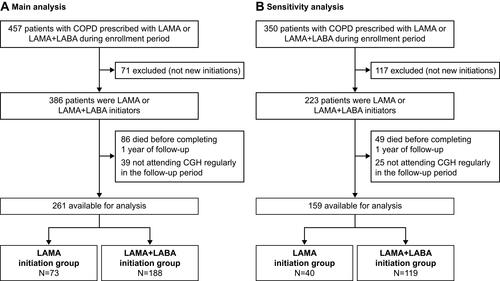
Table 1 Baseline Characteristics
Table 2 Prevalence of Comorbiditiesa in the Study Population
Table 3 Proportion of Patients with Clinical Worsening, a Moderate-to-Severe Exacerbation or a Change in Treatment by Index Maintenance Therapy
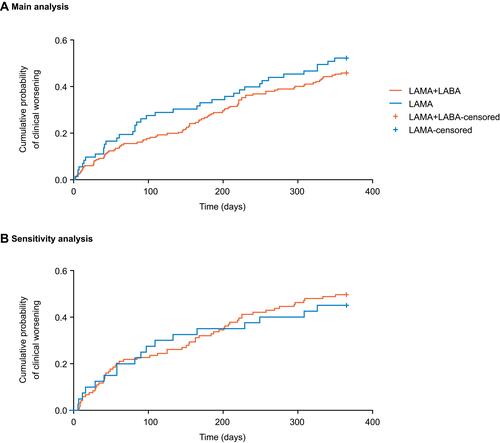
Figure 3 Kaplan–Meier curves of time-to-clinical worsening for (A) the main analysis and (B) the sensitivity analysis.
Abbreviations: LABA, long-acting β2-agonist; LAMA, long-acting muscarinic antagonist.