
Figures & data

Table 1 Differences Between Items and Scores of the Three Questionnaires
Figure 1 The flow of the study and results of screening.
Abbreviations: FEV1/FVC, forced expiratory volume in the first second/forced vital capacity; GOLD, Global Initiative for Chronic Obstructive Lung Disease.
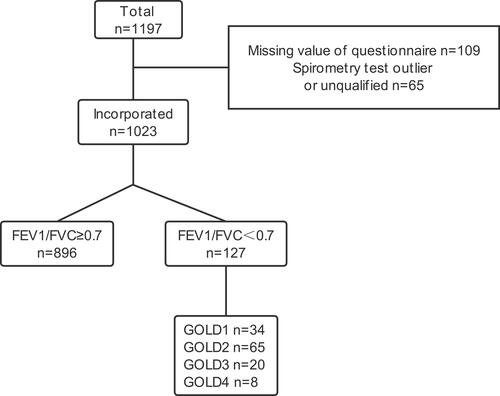
Table 2 Characteristics of Participants with Complete Questionnaire Data and Spirometry Results
Table 3 ROC Curve and Diagnostic Values of the Three COPD Screening Questionnaires
Figure 2 Comparison of ROC curves of the three COPD screening questionnaires. The blue curve is the ROC curve of COPD-PS, the green curve is ROC curve of COPD-SQ, and the Orange curve is of COPD-MH. The marker points are shown as empty circles representing the best cut-off values. Identification of COPD by the three questionnaires were similar.
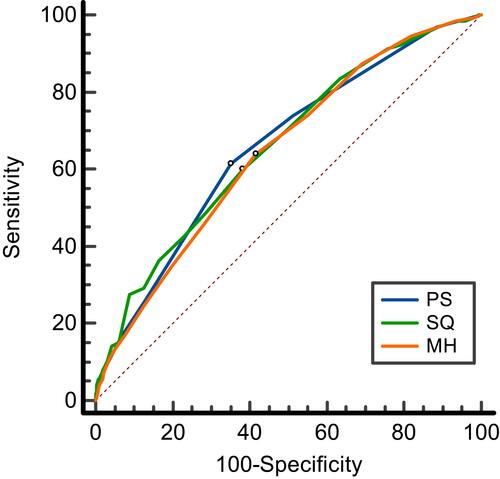
Table 4 Effect of Gender Difference on Cut-off Value, AUC, and Validity of the Three Screening Questionnaires
Figure 3 Gender disparity on different screening questionnaires. A gender value of 1 represents male and 2 represents female. (A) shows the ROC curve of gender disparity for the COPD-PS and the sensitivity for females is higher than males; (B) is the ROC curve of gender disparity for the COPD-SQ; (C) is the ROC curve of gender disparity for the COPD-MH. The marker points are shown as empty circles representing the best cut-off values. The self-designed COPD-MH had higher diagnostic efficiency and higher sensitivity with gender-specific cut-off values for both males and females.
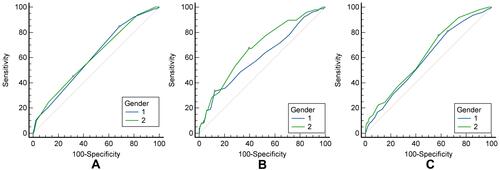
Table 5 Impact of the Severity of COPD on Questionnaire Scores and Diagnostic Accuracy