
Figures & data
Table 1 Participant Demographics
Figure 1 Flow diagram of study participants.
Abbreviation: COPD, chronic obstructive pulmonary disease.
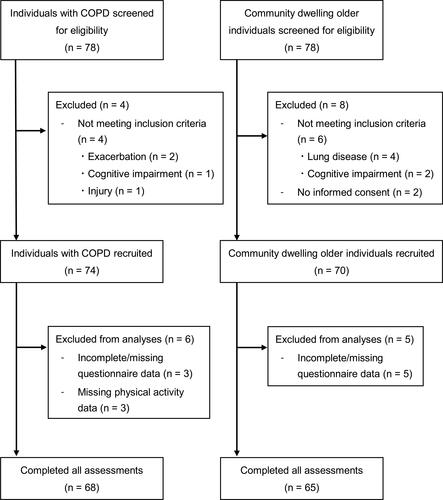
Figure 2 Pain location. 
 Control group.*p<0.05 indicates a significant difference between groups.
Abbreviations: COPD, chronic obstructive pulmonary disease; UL, upper limb; LL, lower limb.
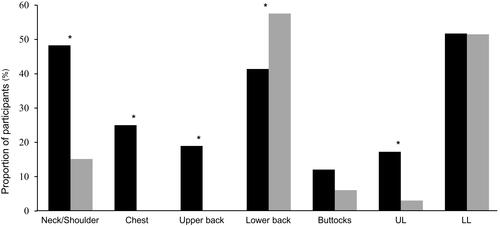
Table 2 Comparison of Characteristics Between the COPD and Control Group with Chronic Pain
Table 3 Clinical Impact of Pain in Participants with COPD