Figures & data
Figure 1 Flow diagram of the systematic search and selection of studies.
Note: Numbers refer to unique records not datasets, except where otherwise indicated.
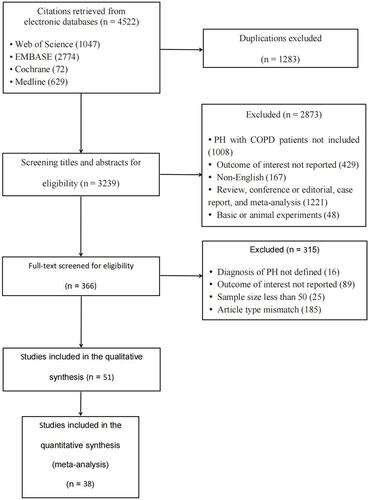
Table 1 Characteristics of Studies Reporting the Prevalence of COPD-Related PH
Figure 2 Forest plot of COPD-related PH prevalence.
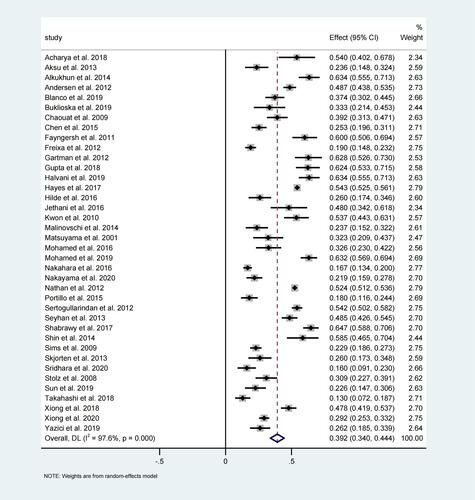
Table 2 Subgroup Analyses of COPD-Related PH Prevalence
Figure 3 Funnel plot, Egger test, and Begg test for assessing publication bias.
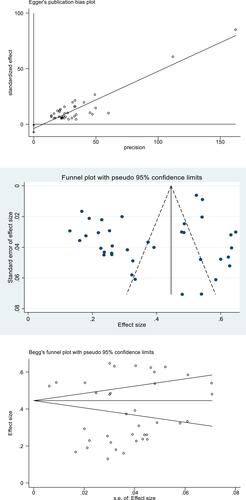
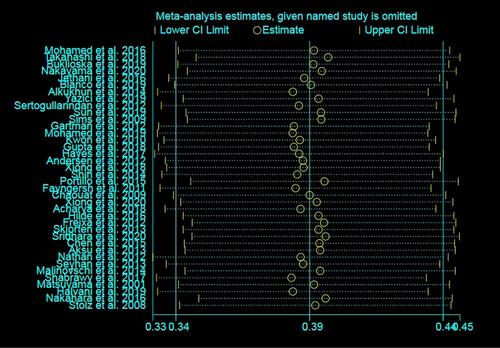
Figure 4 Sensitivity analysis of the COPD-related PH pooled prevalence.