Figures & data
Table 1 Baseline Characteristics per Quartile (Q1–4) of TyG Index (n = 28,282)
Table 2 Incidence of COPD Events by Quartiles of and by 1 Unit Increase in TyG Index
Table 3 Incidence of COPD Events by Quartiles of and by 1 Unit Increase in the TyG Index in Never Smokers (n = 9898)
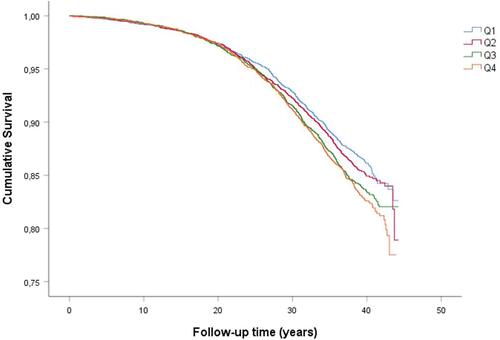
Figure 1 Kaplan–Meier survival curves of incident COPD by quartiles of TyG index. Q1: lowest TyG index, Q4: Highest TyG index.
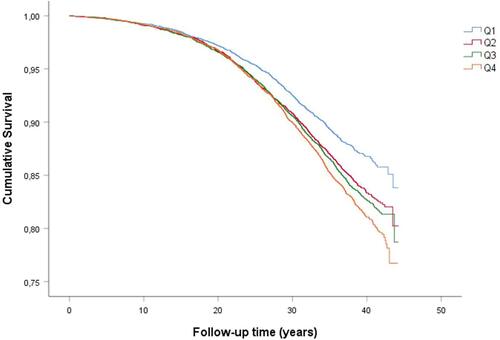
Figure 2 Kaplan–Meier event-free survival curves of incident COPD by quartiles of TyG index in women Q1: lowest TyG index, Q4: Highest TyG index.
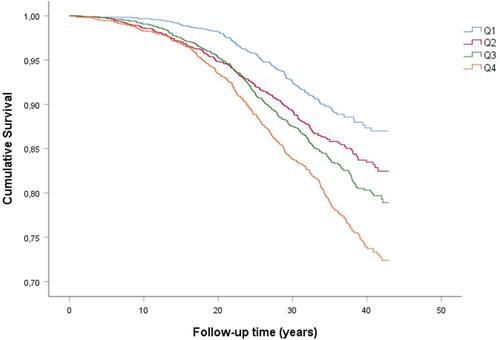
Figure 3 Kaplan–Meier event-free survival curves of incident COPD by quartiles of TyG index in men Q1: lowest TyG index, Q4: Highest TyG index.