
Figures & data
Table 1 Patient and Disease Characteristics
Figure 1 Maximal excursion of the right diaphragm at rest and after 6MWT. p<0.001 for both (A) vs (C) and (B) vs (D). The box represents the interquartile range (IQR). The horizontal black line in the box shows the median. The red dot shows the mean value. The vertical black line shows minimum (Q1 - 1.5*IQR) and maximum (Q3 + 1.5*IQR) values (whiskers). (A) Maximal right diaphragm movement at rest in patients without the primary outcome. (B) Maximal right diaphragm movement after 6MWT in patients without the primary outcome. (C) Maximal right diaphragm movement at rest in patients with the primary outcome. (D) Maximal right diaphragm movement after 6MWT in patients with the primary outcome.
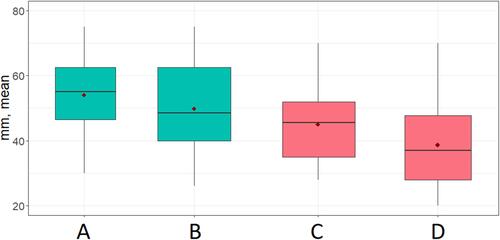
Figure 2 Diaphragmatic movement at rest and after 6MWT according to the GOLD stage. The box represents the interquartile range (IQR). The horizontal black line in the box shows the median. The vertical black line shows minimum (Q1 - 1.5*IQR) and maximum (Q3 + 1.5*IQR) values (whiskers).
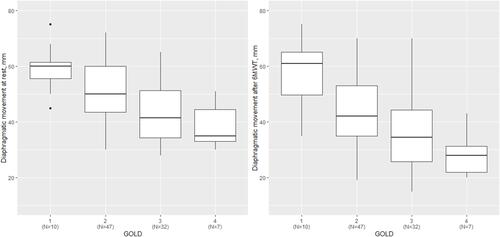
Figure 3 ROC curves for diaphragmatic movement at rest (left) and after 6MWT (right).
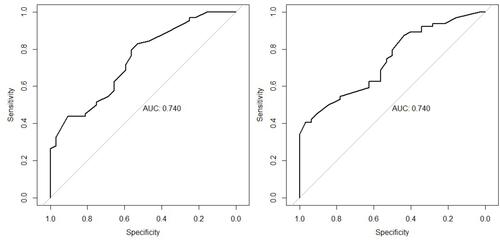
Figure 4 Survival curve for reaching the primary endpoint (time to exacerbation or death) stratified by diaphragmatic movement at rest (≥55 vs <55 mm).
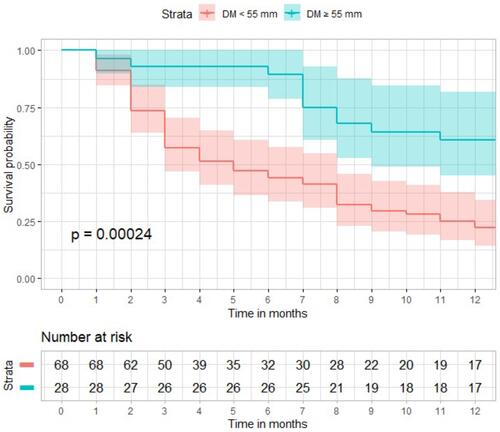
Figure 5 Survival curve for reaching the primary endpoint (time to exacerbation or death) stratified by diaphragmatic movement after 6MWT (≥53 vs <53 mm).
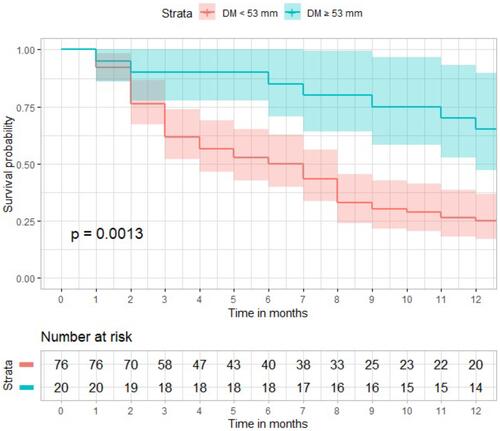
Figure 6 Diaphragmatic movement at rest (left) and after 6MWT (right) according to the exacerbations. The box represents the interquartile range (IQR). The horizontal black line in the box shows the median. The vertical black line shows minimum (Q1 - 1.5*IQR) and maximum (Q3 + 1.5*IQR) values (whiskers).
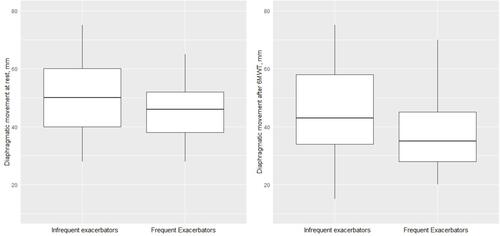
Figure 7 Diaphragmatic movement at rest (left) and after 6MWT (right) according to mMRC group.
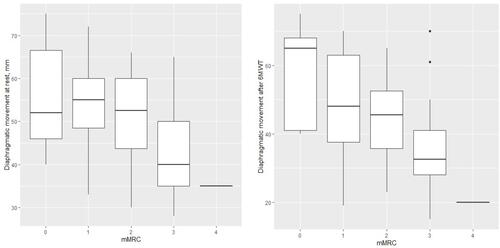
Table 2 Cox Multivariate Analysis to Determine Factors Associated with the Primary Outcome (Exacerbation or Death)