Figures & data
Figure 1 Flowchart of the study.
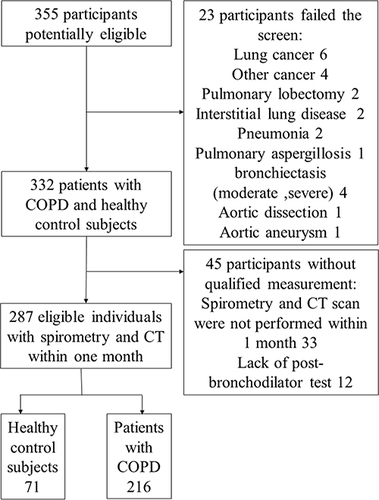
Figure 2 (A) Segmented lung field by setting the threshold between −500 HU and −1024 HU; (B) Converted into binary image where pulmonary vessels were displayed in black with a window level of −720 HU; (C) Mask image after setting the circularity from 0.9 to 1.0 and the vascular size range from 0–5mm2.
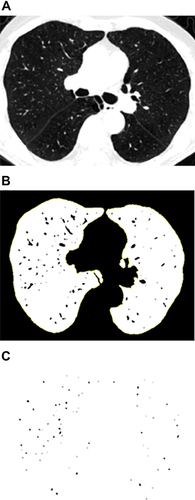
Table 1 Characteristics of Study Participants
Figure 3 Relationship between %CSA<5 and FEV1%pred (r=0.564, P<0.001).
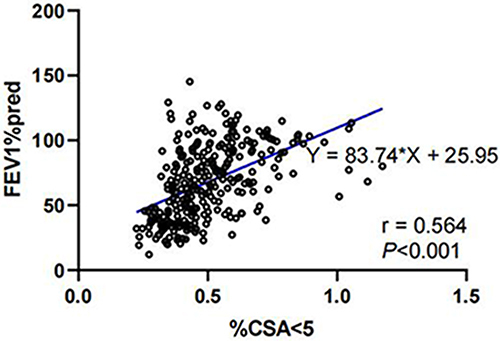
Figure 4 ROC curve of %CSA<5 for the discrimination of COPD. (AUC, 0.816; cut-off value, 0.537; Youden index J, 0.501; sensitivity, 78.24%; specificity, 71.83%).
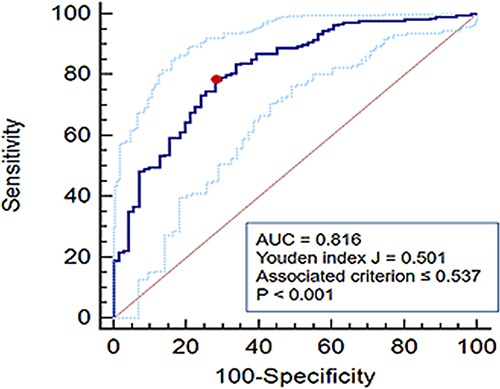
Table 2 Comparison of Characteristics of Participants Above and Below the Inflection Point
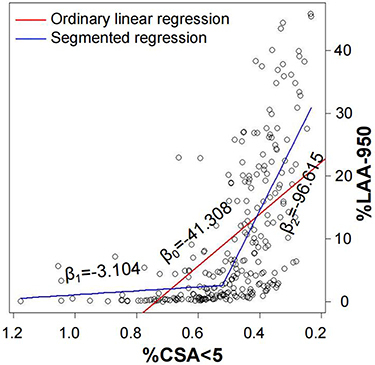
Figure 5 Association between %CSA<5 and %LAA-950. The fitting effect of segmented regression (adjust R2, 0.474; P <0.001) was much better than ordinary linear regression (adjust R2, 0.332, P<0.001). The slope of the ordinary linear regression line was β0 = −41.308. In the segmented regression, before %CSA<5 decrease to inflection point (0.524), the regression line was nearly flat (β1 = −3.104, P < 0.001), while the slope of the regression line suddenly flared up when the %CSA<5 went down below the inflection point (β2 = −96.615, P < 0.001).