
Figures & data
Figure 1 Flow diagram of the subjects enrolled in the study.
Abbreviations: KOLD, Korean Obstructive Lung disease; COPD, chronic obstructive pulmonary disease; CT, computed tomography; EI, emphysema index.
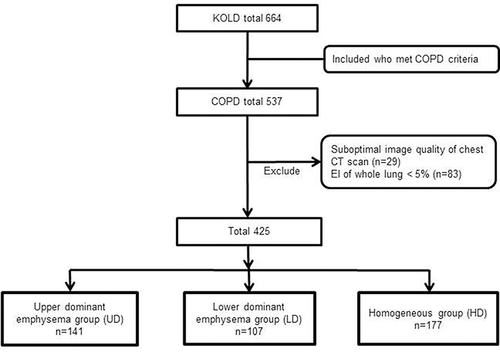
Table 1 Comparison of Baseline Characteristics of the Study Subjects
Table 2 Long-Term Clinical Outcomes in Terms of Emphysema Distribution
Figure 2 Kaplan-Meier curves for the time to first exacerbation (A) and the probability of survival (B) concerning the emphysema distribution.
Abbreviations: UD, upper dominant emphysema group; LD, lower dominant emphysema group; HD, homogeneous group.
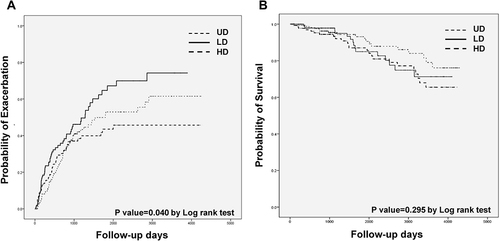
Table 3 Variables Associated with Time to First Exacerbation
Table 4 Response After 3 Months of ICS/LABA Treatment in Non-Severe COPD Patients