Figures & data
Table 1 Clinicopathological Characteristics of the Chinese Cohort
Figure 1 Analysis of our Chinese cohort. (A) Heatmap of 539 cancer related genes mutation of COPD-LC (n = 21) and non-COPD-LC (n = 68) in our Chinese cohort. (B) Comparison of differential mutation genes displayed within COPD-LC and non-COPD-LC. (C) Comparison of TMB within COPD-LC and non-COPD-LC. (D) Relationship of differential mutation genes and TMB in COPD-LC (LRP1B and PREX2). (E) PD-L1 expression status with COPD-LC and non-COPD-LC. Notes: *P < 0.05; **P < 0.01; ***P <0.001.
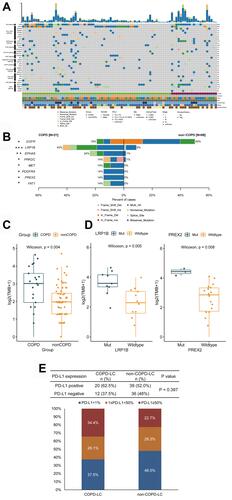
Figure 2 Survival analysis of EGFR mutant patients with EGFR-TKI treatment. (A) Kaplan–Meier curves of PFS in EGFR mutant COPD-LC and non-COPD-LC patients. (B) Multivariate Cox regression analysis of EGFR mutant patients with EGFR-TKI treatment.
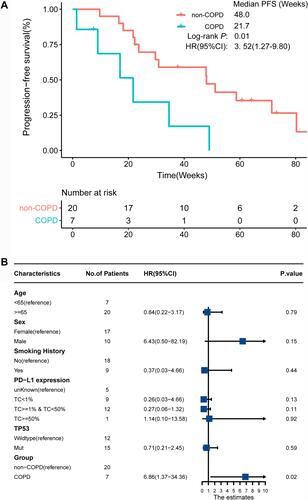
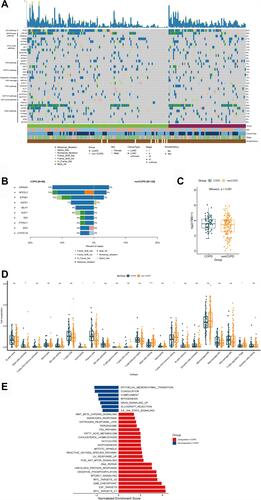
Figure 3 Analysis of TCGA cohort. (A) Heatmap of 539 cancer related genes mutation of COPD-LC (n = 69) and non-COPD-LC (n = 126) in TCGA cohort. (B) Comparison of differential mutation genes displayed within COPD-LC and non-COPD-LC. (C) Comparison of TMB within COPD-LC and non-COPD-LC. (D) Boxplot depicting the infiltration of 22 immune cells in COPD-LC and non-COPD-LC. CIBERSORT was used to calculate the infiltration degree of these immune cells. (E) Differences in pathway activities scored by GSEA Hallmark collection between COPD-LC and non-COPD-LC. Enrichment results with significant associations between COPD-LC and non-COPD-LC are shown (P < 0.05, FDR < 0.05). Notes: *P < 0.05; **P < 0.01; ****P < 0.0001.