Figures & data
Table 1 Baseline Characteristics
Table 2 Results from Multivariate Regression Analyses of the Dependent Variables Given in the Top Row and the Predictors Given Below
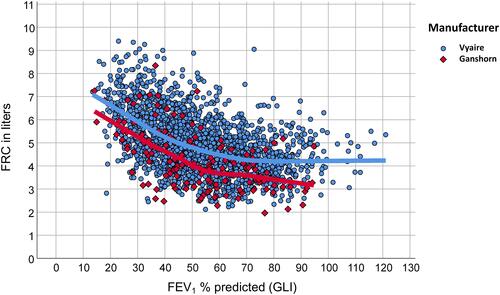
Figure 1 Difference in FRC between body plethysmographs. The horizontal axis shows FEV1 % predicted (GLI), the vertical axis FRC in litres measured by either the Vyaire (blue circles, n=1988) or the Ganshorn (red diamonds, n=156) plethysmograph. Additionally, LOESS fit lines are shown for both groups in the respective colors, indicating a difference of more than 0.5 litres between FRC values at a given value of FEV1 % predicted. When residual terms after adjustment for FEV1, FVC, sex, age, height and BMI were used, essentially the same picture was obtained, with the difference that the dependence on FEV1 disappeared. This demonstrated that the difference shown in the graph was not due to residual confounding but a robust result even in unadjusted data.