Figures & data
Table 1 Characteristics of Study Participants
Figure 1 Flowchart of the study participants.
Note: Overall, 4427 participants were included in this study, of which 2784 were men and 1580 were women.
Abbreviation: IPAG, International Primary Airways Group.
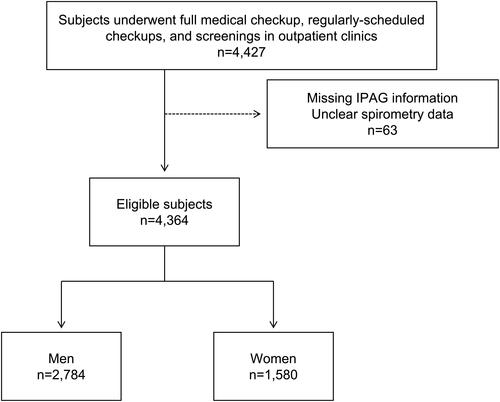
Table 2 Prevalence of Airflow Limitation and Odds Ratios for Male Participants
Table 3 Prevalence of Airflow Limitation and Odds Ratios for Female Participants
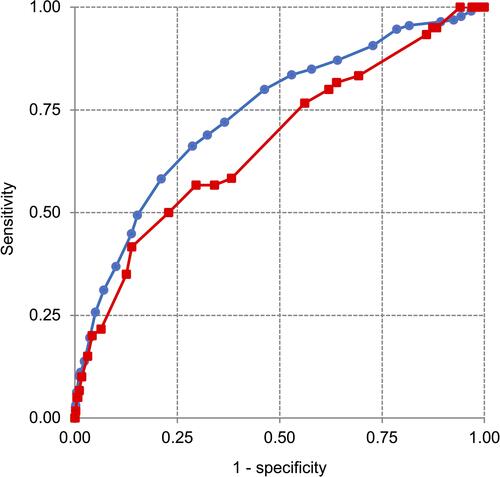
Table 4 The Sensitivity and Specificity of Different Cut-off Scores for Identifying Participants with Airflow Limitation
Figure 2 Receiver operating characteristic (ROC) curves for International Primary Airways Group questionnaire scores by sex (men: ![]()