Figures & data
Table 1 Characteristics of the Primary Study Population at Visit 1
Table 2 Comorbidities of the Primary Study Population at Visit 1
Figure 1 Prevalence of comorbidities over the study visits 1 to 5, scheduled at enrolment and follow-up after 6, 18, 36 and 54 months, respectively. Data refer to patients with all four follow-up visits.
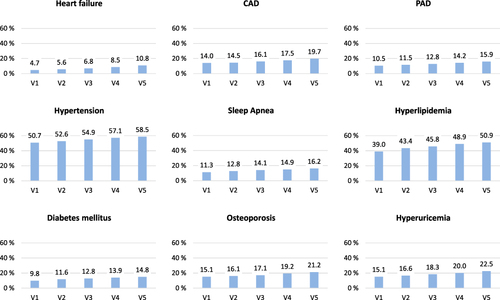
Table 3 Results from Generalized Logistic Models with Repeated-Measures Design and Logit Link
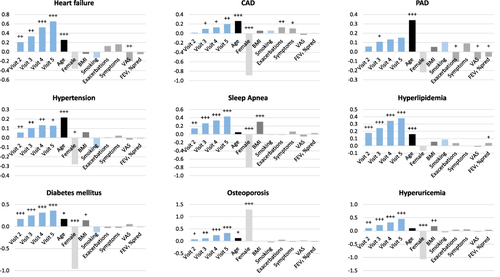
Figure 2 Results from generalized logistic regression models for the prevalence of comorbidities. Dependent variables are given in the headline and estimated regression coefficients in the columns. The effects of age are given per 5 years, of BMI per 5 units, of VAS per 20 units, and of FEV1 per 10% predicted. Scales are different among comorbidities. Significance levels are denoted as follows: +p<0.05, ++p<0.01 and +++p<0.001. Data refer to patients with all four follow-up visits, and numerical values are given in (further details are given in Supplemental Table S1).