Figures & data
Table 1 Model Input Parameters for the Spanish Population of the IMPACT Trial
Table 2 Costs by Health State and Exacerbation Event
Table 3 Base Case Results with FF/UMEC/VI versus FF/VI and versus UMEC/VI (Spanish IMPACT Population)
Figure 1 Sensitivity (A) and scenario (B) analyses for FF/UMEC/VI versus FF/VI in the Spanish IMPACT population.
Notes: aSensitivity analyses setting the 95% CI for the SGRQ treatment effect to the upper and lower bounds did not alter the base case ICER. Vertical line represents the base case. Orange/grey bars represent the ICER per QALY gained for each sensitivity/scenario analysis when the variable is adjusted to the low/high value.
Abbreviations: CI, confidence interval; FEV1, forced expiratory volume in 1 second; FF, fluticasone furoate; HRQoL, health-related quality of life; ICER, incremental cost-effectiveness ratio; QALYs, quality-adjusted life years; SGRQ, St George’s Respiratory Questionnaire; SGRQ-C, St George’s Respiratory Questionnaire for patients with chronic obstructive pulmonary disease; UMEC, umeclidinium; VI, vilanterol.
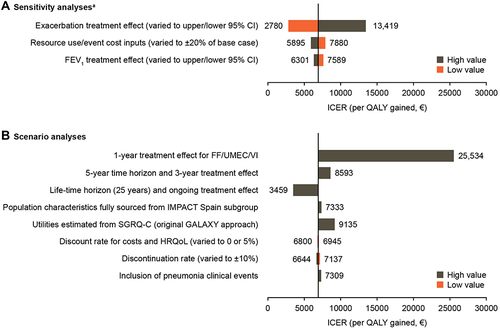
Figure 2 PSA results FF/UMEC/VI versus FF/VI: (A) incremental cost-effectiveness plane; (B) net benefit acceptability curve (Spanish IMPACT population).
Abbreviations: FF, fluticasone furoate; QALYs, quality-adjusted life years; UMEC, umeclidinium; VI, vilanterol.
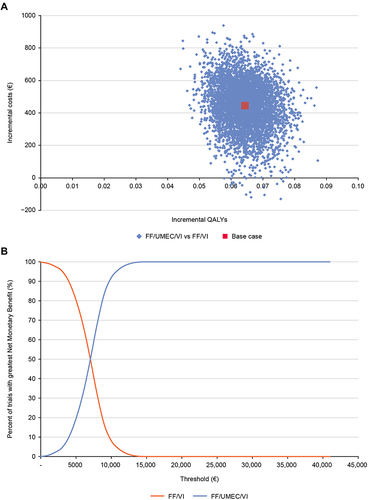
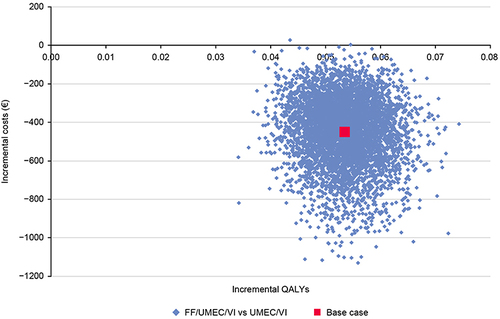
Figure 3 PSA results incremental cost-effectiveness plane for FF/UMEC/VI versus UMEC/VI (Spanish IMPACT population).
Abbreviations: FF, fluticasone furoate; QALYs, quality-adjusted life years; UMEC, umeclidinium; VI, vilanterol.