Figures & data
Table 1 Patient Characteristics
Figure 1 Representative photograph of PCR-RFLP analysis of p53 gene codon 72 polymorphisms. PCR-amplified genomic DNA corresponding to the p53 gene was digested with BstUI, which distinguishes among p53 genotypes. Lane 1 shows the DNA ladder marker, lane 2 shows the PCR product without restriction digestion, lane 3 shows the p53 codon 72 CC genotype, lane 4 shows the GG genotype, and lane 5 shows the CG genotype.
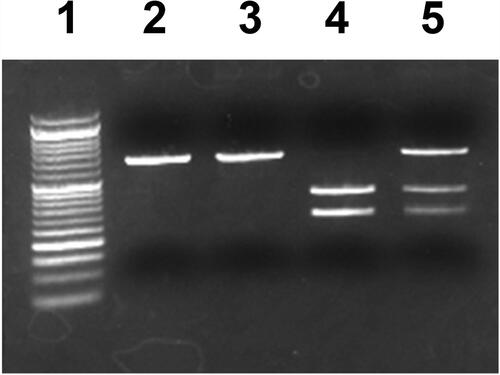
Figure 2 Derivatives of reactive oxygen metabolites (d-ROMs) (A), biological antioxidant potential (BAP) (B), and oxidative stress index (OSI) (C) in serum from smoker controls (control) and patients with moderate chronic obstructive pulmonary disease (COPD) (moderate), mild COPD (mild), and severe COPD (severe). d-ROM levels and OSI were significantly higher in patients with severe COPD compared with the control and moderate COPD patient groups. No significant differences were observed in BAP between the groups. Data are expressed as mean ± SD.
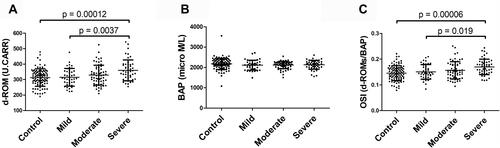
Figure 3 D-ROM levels (A), BAP (B), OSI (C), and high-sensitivity C-reactive protein (HsCRP) levels (D) in serum from current and ex-smokers. Data are expressed as mean ± SD. BAP was significantly increased and OSI significantly decreased in ex-smokers compared with current smokers.
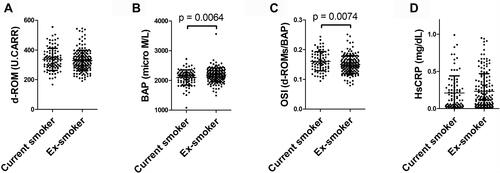
Figure 4 Results of correlation analyses between d-ROM levels and percent forced vital capacity, predicted (%FVC) (A), percent forced expiratory volume in 1 second, predicted (%FEV1) (B), percent low-attenuation area (LAA%) (C), and between OSI and %FVC (D), %FEV1 (E), and LAA% (F). d-ROM levels were weakly correlated with %FVC and %FEV1.
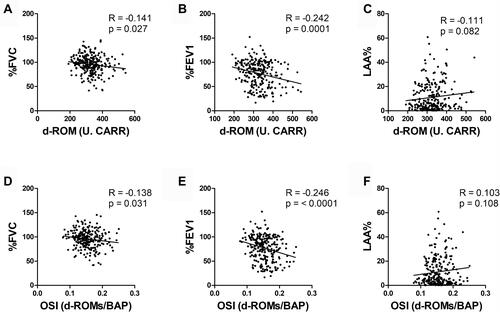
Figure 5 Results of correlation analyses between d-ROM levels and body mass index (BMI) (A), cross-sectional area of the erector spinae muscles (ESMCSA) (B), creatinine/cystatin C ratio (Cr/CysC ratio) (C), and between OSI and BMI (D), ESMCSA (E), and Cr/CysC ratio (F). d-ROM levels and OSI were weakly correlated with ESMCSA and Cr/CysC ratio.
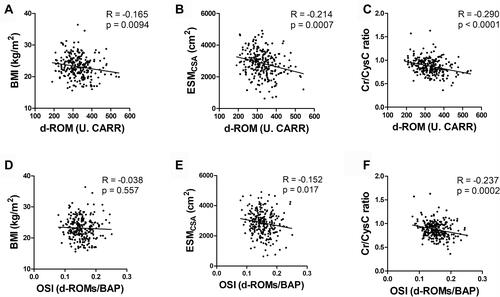
Table 2 Characteristics of Patients Categorized by p53 Codon 72 Genotype
Table 3 p53 Genotype Frequencies in COPD Patients
Table 4 p53 Allele Frequencies in COPD Patients
Figure 6 D-ROM levels in serum from smoker controls (control) and patients with moderate COPD (moderate), mild COPD (mild), and severe COPD (severe) carrying the p53 codon 72 CC genotype (A), CG genotype (B), and GG genotype (C). BAP of serum from controls and patients with moderate, mild, and severe COPD carrying the p53 codon 72 CC genotype (D), CG genotype (E), and GG genotype (F). OSI in serum from patients carrying p53 codon 72 CC genotype (G), CG genotype (H), and GG genotype (I). Data are expressed as mean ± SD. d-ROM levels and OSI in patients with severe COPD were significantly increased among those carrying the GG genotype compared with control subjects and patients with moderate and mild COPD. Only among patients with mild COPD carrying the CC genotype were d-ROM levels increased compared with control subjects.
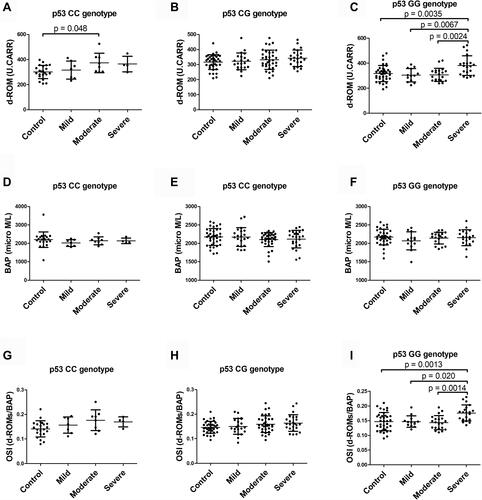
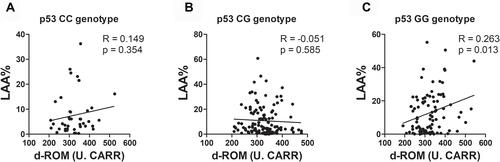
Figure 7 Results of correlation analyses between d-ROM levels and LAA% in patients carrying the p53 codon 72 CC genotype (A), CG genotype (B) and GG genotype (C). d-ROM levels were weakly correlated with LAA% in patients carrying the GG genotype.