Figures & data
Figure 1 Consort diagram of the study.
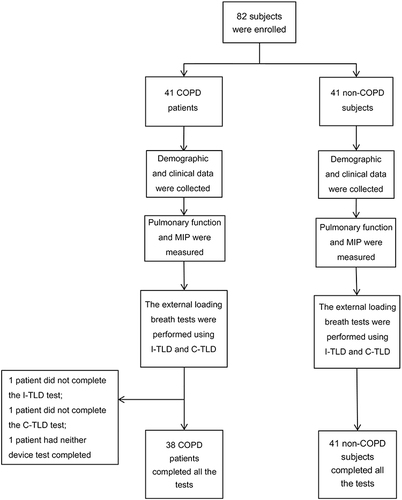
Figure 2 Load rising modes of the two devices. (A) Load rising mode of C-TLD. (B) Load rising mode of I-TLD.
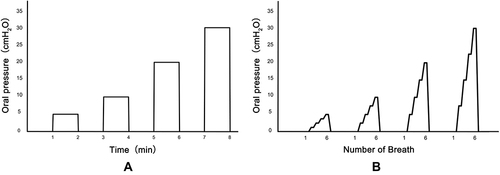
Table 1 General Characteristics of Enrolled COPD and Non-COPD Subjects
Table 2 Borg Scores and Slope a Measured by the Two Devices in COPD and Non-COPD Subjects
Figure 3 Distribution of linear regression coefficient (slope a) in the two devices. (A) Distribution of linear regression coefficient (slope a) in patients with COPD. (B) Distribution of linear regression coefficient (slope a) in non-COPD subjects.
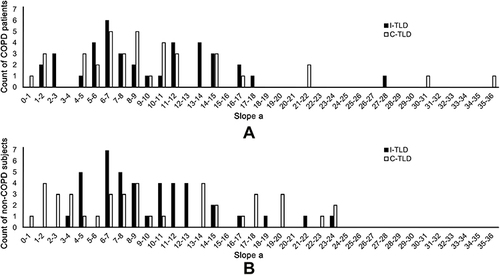
Figure 4 Scatter plot of slope a for the two devices. (A) Scatter plot of slope a in patients with COPD. (B) Scatter plot of slope a in non-COPD subjects.
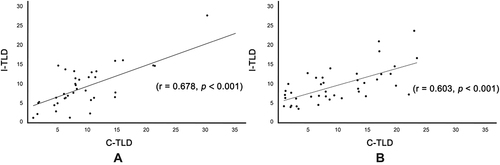
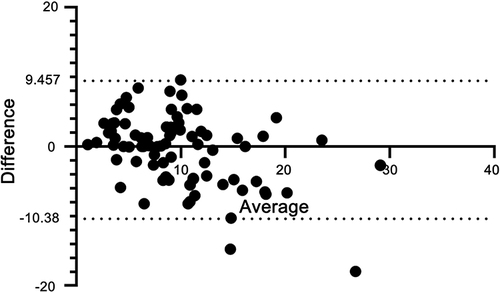
Figure 5 Consistency evaluation of slope a in all subjects for the two devices.