Figures & data
Table 1 Baseline Characteristics of the ITT Population
Table 2 Baseline Characteristics of the ITT Population by Recent Exacerbation Subgroup
Table 3 On-Treatment Moderate/Severe and Severe Exacerbations of the ITT Population by Recent Exacerbation Subgroup
Figure 1 Rate of on-treatment moderate/severe exacerbations up to Week 24 by recent exacerbation subgroup. aPre-specified. bIn the year prior to study entry. cPost hoc.
Abbreviations: BUD, budesonide; CI, confidence interval; FF, fluticasone furoate; FOR, formoterol; ITT, intent-to-treat; UMEC, umeclidinium; VI, vilanterol.
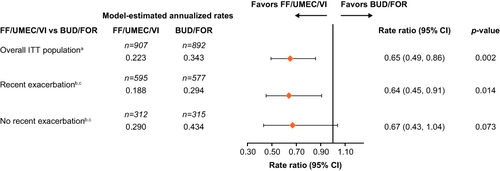
Figure 2 Rate of on-treatment severe exacerbations up to Week 24 by recent exacerbation subgroup. aPost hoc. bIn the year prior to study entry.
Abbreviations: BUD, budesonide; CI, confidence interval; FF, fluticasone furoate; FOR, formoterol; ITT, intent-to-treat; UMEC, umeclidinium; VI, vilanterol.
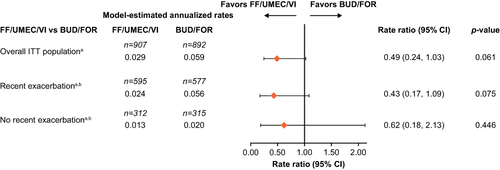
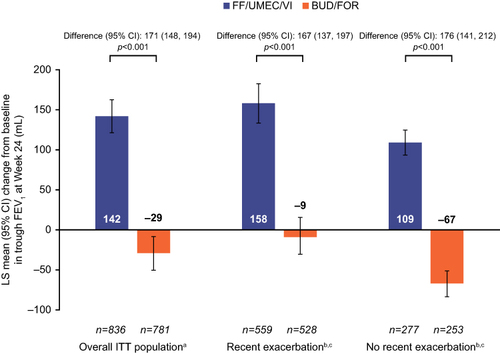
Figure 3 Change from baseline in trough FEV1 at Week 24 by recent exacerbation subgroup. aPre specified. bIn the year prior to study entry. cPost hoc.
Abbreviations: BUD, budesonide; CI, confidence interval; FEV1, forced expiratory volume in1 second; FF, fluticasone furoate; FOR, formoterol; ITT, intent-to-treat; LS, least-squares; UMEC, umeclidinium; VI, vilanterol.