
Figures & data
Figure 1 Flowchart of participant selection.
Abbreviations: COPD, chronic obstructive pulmonary disease; CT, computed tomography; PFTs, pulmonary function tests; PRISm, Preserved Ratio Impaired Spirometry.
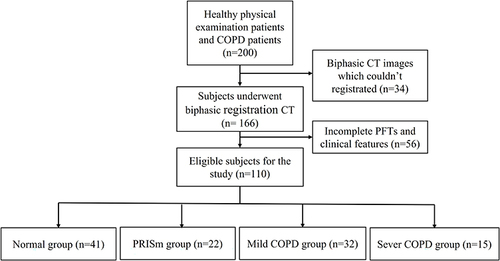
Figure 2 Schematic diagram of parameter measurement in biphasic quantitative CT.
Notes: (A) Identification and segmentation of lung fissures and lobes on CT images by the 3D adaptive border marching algorithm and the implicit surface functions. The principal curvatures and the principal directions were used to distinguish pulmonary vessels from lung tissue, and the vascular tree was automatically extracted and segmented to calculate IPVV in the whole lung. (B) Normal lung tissue areas (green), emphysema areas (red), and functional small disease areas (yellow) were quantified by the PRM method.
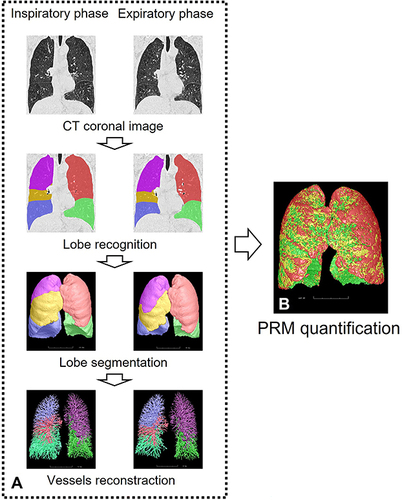
Table 1 Comparison of Subject’s Baseline Characteristics and PFTs
Table 2 Comparison of Subjects’ Quantitative CT Indexes
Table 3 Correlations Between IPVV and PFTs
Table 4 Correlations Between PRM Indexes and PFTs
Figure 3 Correlations between IPVV and PFTs.
Notes: Scatter plots were drawn, and Spearman’s rank correlation was used. A P value <0.05 was considered statistically significant. (A) Correlation between inspiratory IPVV and FEV1%. (B) Correlation between inspiratory IPVV and FEV1/FVC. (C) Correlation between expiratory IPVV and FEV1%. (D) Correlation between expiratory IPVV and FEV1/FVC. (E) Correlation between IPVV relative value and FEV1%. (F) Correlation between IPVV relative value and FEV1/FVC. (G) Correlation between IPVV difference value and FEV1%. (H) Correlation between IPVV difference value and FEV1/FVC.
Abbreviations: FEV1, forced expiratory volume in 1 second; FEV1%, predicted value of forced expiratory volume in 1 second; FVC, forced vital capacity; IPVV, intrapulmonary vascular volume; IPVVin, inspiratory intrapulmonary vascular volume; IPVVex, expiratory intrapulmonary vascular volume.
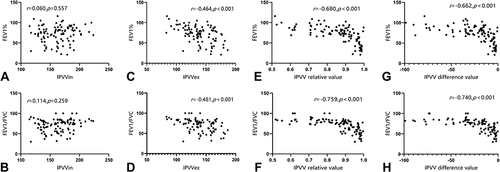
Figure 4 Correlations between PRM indexes and PFTs.
Notes: Scatter plots were drawn, and Spearman’s rank correlation was used. A P value <0.05 indicated a statistically significant difference. (A) Correlation between Emph% and FEV1%. (B) Correlation between Inspiratory Emph% and FEV1/FVC. (C) Correlation between fsAD% and FEV1%. (D) Correlation between fsAD% and FEV1/FVC. (E) Correlation between Normal% and FEV1%. (F) Correlation between Normal% and FEV1/FVC.
Abbreviations: Emph%, emphysema volume ratio; fsAD%, functional small airway lesions volume ratio; Normal%, normal areas volume ratio; FEV1, forced expiratory volume in 1 second; FEV1%, predicted value of forced expiratory volume in 1 second; FVC, forced vital capacity.
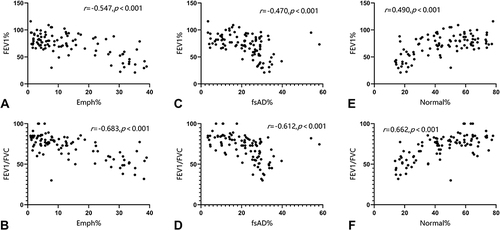
Table 5 Correlations Between IPVV and PRM Indexes
Figure 5 Correlations between IPVV and PRM indexes.
Notes: Scatter plots were drawn, and Spearman’s rank correlation was used. A P value <0.05 indicated a statistically significant difference. (A) Correlation between Inspiratory IPVV and Emph%. (B) Correlation between inspiratory IPVV and fsAD%. (C) Correlation between inspiratory IPVV and Normal%. (D) Correlation between expiratory IPVV and Emph%. (E) Correlation between expiratory IPVV and fsAD%. (F) Correlation between expiratory IPVV and Normal%. (G) Correlation between IPVV relative value and Emph%. (H) Correlation between IPVV relative value and fsAD%. (I) Correlation between IPVV relative value and Normal%. (J) Correlation between IPVV difference value and Emph%. (K) Correlation between IPVV difference value and fsAD%. (L) Correlation between IPVV difference value and Normal%.
Abbreviations: IPVV, intrapulmonary vascular volume; IPVVin, inspiratory intrapulmonary vascular volume; IPVVex, expiratory intrapulmonary vascular volume; Emph%, emphysema volume ratio; fsAD%, functional small airway lesions volume ratio; Normal%, normal areas volume ratio.
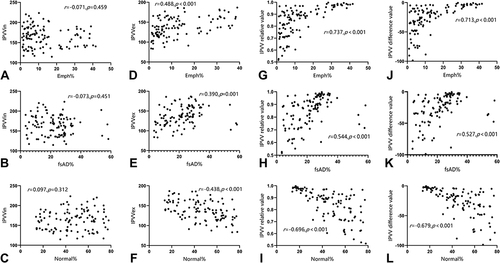
Table 6 Multiple Linear Regression Analysis of IPVV in Emph% and fsAD%