Figures & data
Table 1 Participants Characteristics at Baseline (V0)
Table 2 Post-Treatment Outcomes (V1)
Figure 1 Daily oral corticosteroids intake.
Notes: Cases that had not completed 12 months of anti-IL5/5R treatment at the time of data collection are represented by grey lines. Oral corticosteroids intake for cases 2 and 3 were collected respectively at 5 and 6 months (time of the last visit available) after the initiation of the biologic.
Abbreviation: OCS, oral corticosteroids.
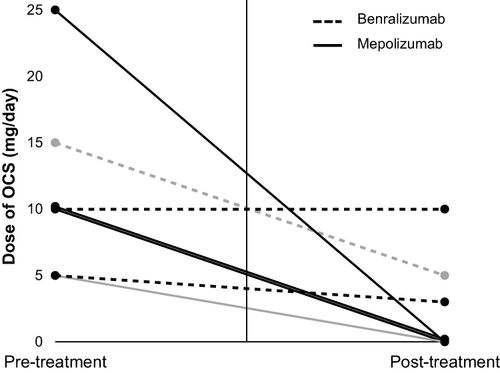
Figure 2 Annual exacerbation rate.
Notes: Cases that had not completed 12 months of anti-IL5/5R treatment at the time of data collection are represented by grey lines. Annual exacerbation rate for cases 2 and 3 were collected respectively at 5 and 6 months (time of the last visit available) after the initiation of the biologic.
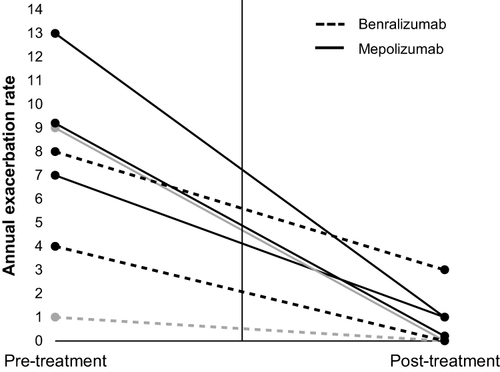
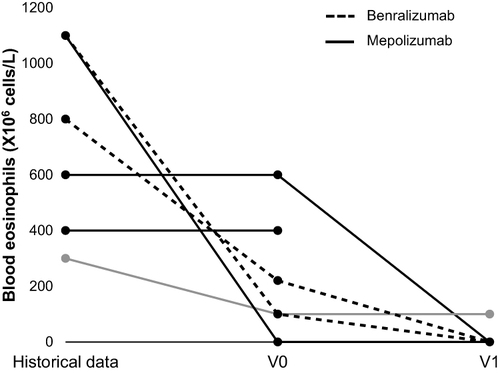
Figure 3 Blood eosinophils levels.
Notes: Historical blood eosinophil level was measured in the last 3 years before baseline visit (V0). Cases that had not completed 12 months of anti-IL5/5R treatment at the time of data collection are represented by grey lines. Blood eosinophil levels for cases 2 and 3 were collected respectively at 5 and 6 months (time of the last visit available) after the initiation of the biologic.