Figures & data
Table 1 Potential Adverse Health Conditions and Events of Interest
Table 2 Patient Characteristics for Total Study Population (N=183,637)
Table 3 OCS Use Patterns
Figure 1 Cumulative distribution of OCS episodes by days supplied.
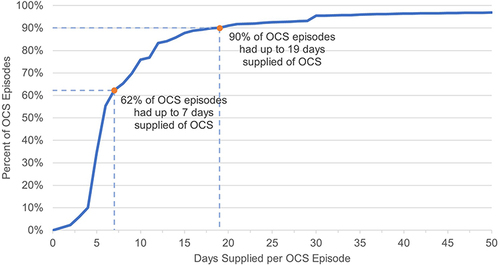
Table 4 COPD Exacerbations by Severity for Initial 12-Month Period and by Cumulative Prednisolone Exposure Over 48-Month Period
Table 5 Comorbidities and Potential Adverse Health Outcomes Identified in the Baseline and Post-Index Periods
Figure 2 Potential adverse health outcomes in months 1–48 post-index by OCS exposure.
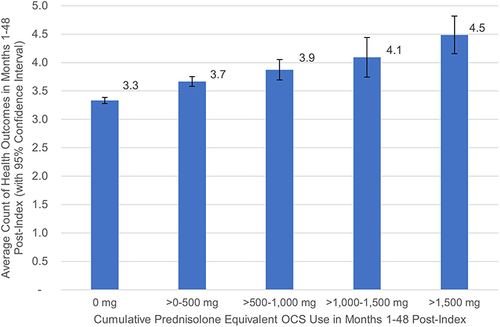
Figure 3 Hazard Ratios for univariate regressions by cumulative prednisolone equivalent OCS dose in mg (vs 0 mg) for (A) heart failure and (B) cardiovascular disease.a
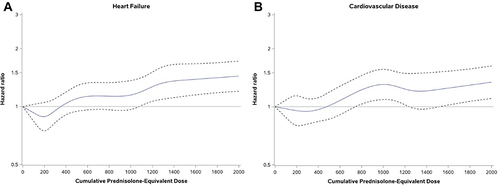
Table 6 Multivariable Regression Results for Cumulative OCS Dose
Table 7 Multivariable Regression Results for Cumulative OCS Dose – Excluding Patients with COPD Hospitalizations in the 48 Months Post-Index (Includes 80% of Study Population)
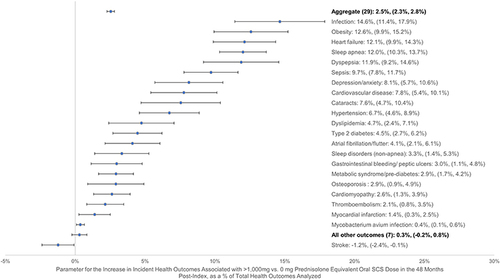
Figure 4 Parameter (as percent of the total number of outcomes analyzed) and 95% confidence interval for the increase in specified health outcomes associated with >1000 mg vs 0 mg prednisolone equivalent OCS dose in the 48 months post-index.