Figures & data
Table 1 Comparison of Baseline Characteristics, Admission Parameters, and Year of Hospitalization Between Macrolide and Non-Macrolide Groups: Original Cohort (n = 1882) and Propensity-Matched Cohort (n = 1528). All Admission Records of AECOPD Patients Between October 2015 and September 2018
Table 2 Macrolides and Other Antibiotic Co-Administrations and Systemic Steroids
Figure 1 Study flow chart of all AECOPD patients admitted to the medical general ward and medical intensive care unit.
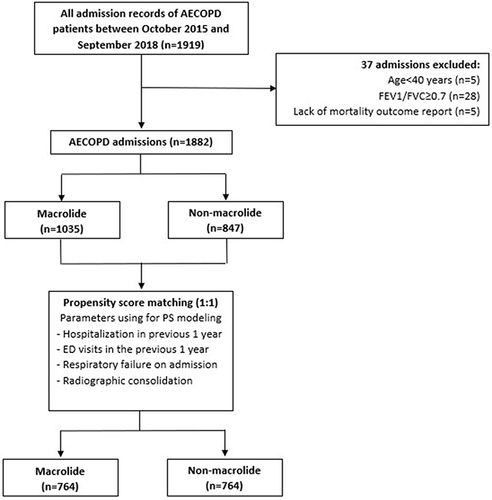
Table 3 Logistic Regression Models for the Derivation of the Propensity Score
Table 4 Microbiological Results Including Sputum and Tracheal Aspiration Cultures of Hospitalized Acute Exacerbation of COPD Patients in Propensity-Matched Cohort (n = 1092 Admissions)
Figure 2 Kaplan–Meier survival curve shows the impact on in-hospital mortality of macrolide treatment.
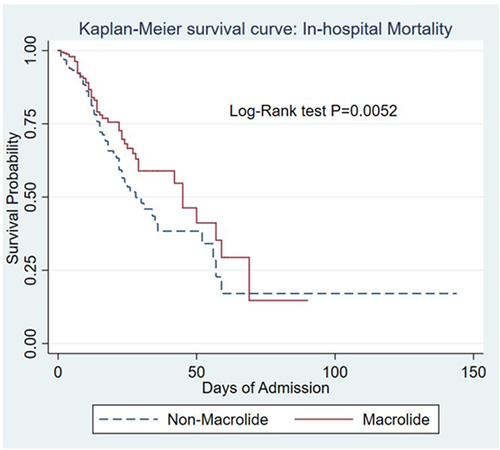
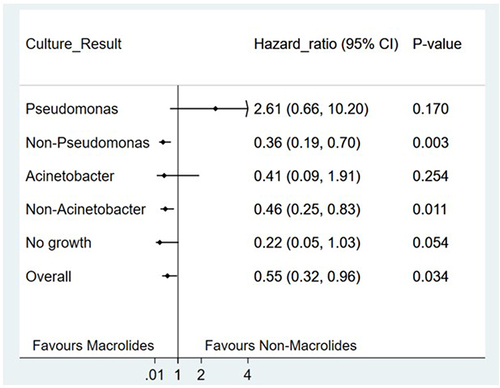
Figure 3 Risk of in-hospital mortality by subgroups of culture results in patients treated with macrolides vs non-macrolides.