Figures & data
Figure 1 Subjects included for analysis.
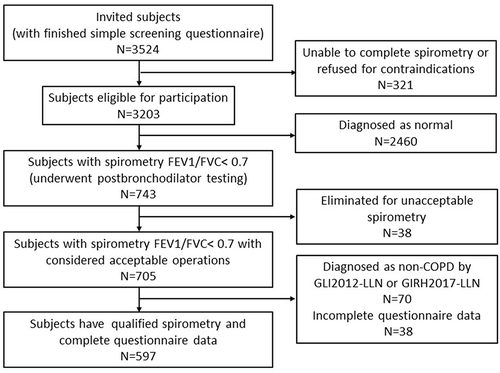
Table 1 Consistency of AFL and COPD-SQ Score Groups and Clinical Characteristics of Each Group
Table 2 Severity Classification and Characteristics of Patients with GLI-2012 and GIRH-2017 FEV1 Predicted Value Reference Equations
Table 3 Severity Distribution and Differences of 597 COPD Patients Classified by GIRH-2017 and GLI-2012 FEV1 Predicted Value Reference Equations
Table 4 Correlations Between FEV1%pred and CAT Scores, mMRC Grades, CCQ Scores, and Average AEs with GLI-2012 and GIRH-2017 FEV1 Reference Equations
Figure 2 Distribution of symptoms and exacerbation risk assessments of AFL severity under GIRH-2017 and GLI-2012 FEV1 predicted reference equations. Subfigures (A–D) represent the assessments of CAT scores (A), mMRC grades (B), CCQ scores (C), AE histories in the last year (D) of GOLD grades under the two FEV1 predicted reference equations respectively. Data were collected from 597 patients who were diagnosed with COPD by GOLD 0.7 fixed ratio and both the GLI-2012 and GIRH-2017 LLN diagnosis thresholds. Data were shown as the mean with standard error. t-test was used for statistical analysis.
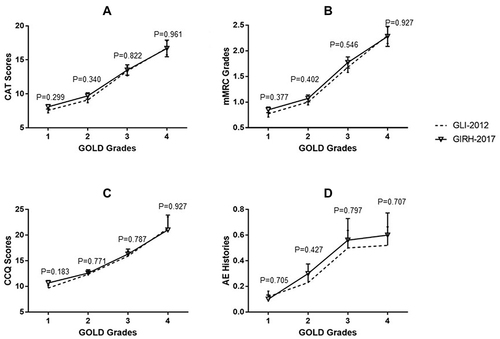
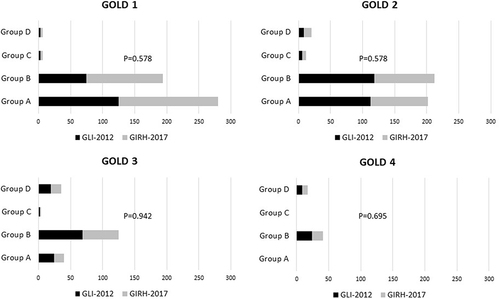
Figure 3 ABCD assessment scheme in every GOLD grade with GIRH-2017 and GLI-2012 FEV1 predicted reference equations. Data were collected from 597 patients who were diagnosed with COPD by GOLD 0.7 fixed ratio and both the GLI-2012 and GIRH-2017 LLN diagnosis thresholds. Chi-square test was used for comparison of ABCD groups distribution with the two reference equations.