Figures & data
Table 1 General Characteristics of All Participants
Figure 1 Elevated expression of ADAM9 and IL-17A in the airway epithelia of patients with chronic obstructive pulmonary disease (COPD). (A) Bright-field micrographs of the airway epithelia in non-smokers (NS, n = 7), smokers (S, n = 10), and COPD patients (COPD, n = 8). Positive immunoreactivity of ADAM9 and IL-17A was visualized by immunohistochemistry and 3,3′-diaminobenzidine (DAB) detection chromogen (brown). Scale bar = 100 μm. Quantitative analysis of ADAM9 (B) and IL-17A (C) was performed using mean optical density. (D) Correlation of the mean optical density between ADAM9 and IL-17A in the airway epithelia of three groups of people (n = 25). (E) Correlation between the mean optical density of IL-17A in airway epithelia and FEV1/FVC in smokers and patients with COPD (n = 18). *p < 0.05.
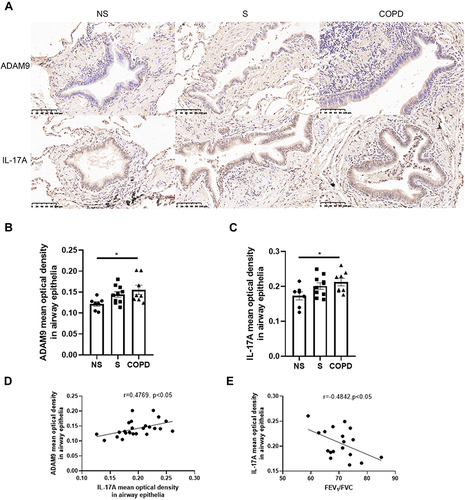
Figure 2 Increased expression of ADAM9 in the alveolar epithelia of patients with chronic obstructive pulmonary disease (COPD). (A) Representative images of ADAM9 and IL-17A in the alveolar epithelia of non-smokers (NS, n = 7), smokers (S, n = 10), and COPD patients (COPD, n = 8). Scale bar = 50 μm. Quantitative analysis of ADAM9 (B) and IL-17A (C) was performed using mean optical density. (D) Correlation of the mean optical density between ADAM9 and IL-17A in the alveolar epithelia of three groups of people (n = 25). *p < 0.05.
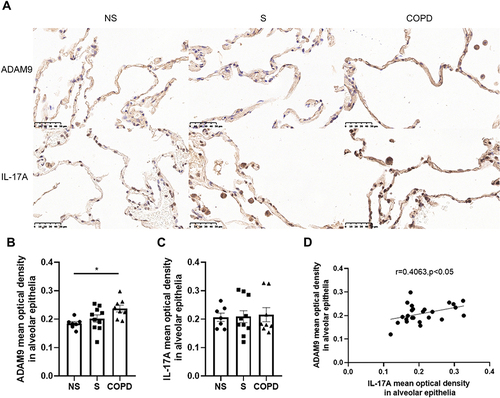
Figure 3 Expression of ADAM9 is down-regulated by Il17a knockout in CS-exposed mice. Wild-type (WT) mice and Il17a−/− mice were exposed to cigarette smoke (CS) or room air for six months. (A) Representative H&E staining images of the lung tissue sections in room air-exposed WT mice (n = 3), CS-exposed WT mice (n = 3), and CS-exposed Il17a−/− mice (n = 2). Scale bar = 100 μm. Mean linear intercept (MLI) (C) and destructive index (DI) (D) were measured to evaluate the degree of emphysema. (B) Immunohistochemical staining of ADAM9 in the airway epithelia of room air-exposed WT mice (n = 3), CS-exposed WT mice (n = 3), and CS-exposed Il17a−/− mice (n = 2). Scale bar = 100 μm. (E) Quantitative analysis of ADAM9 was performed using mean optical density. *p < 0.05, **p < 0.01.
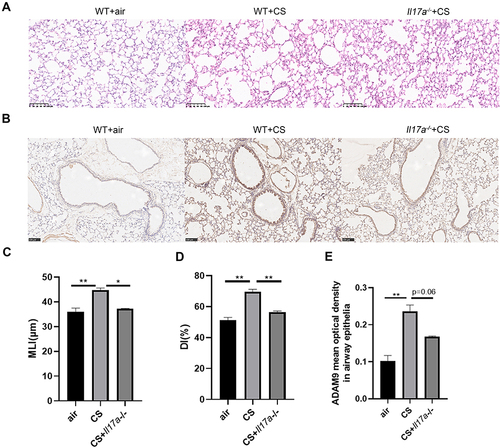
Figure 4 Cigarette smoke exposure induces the expression of ADAM9 and IL-17A in human bronchial epithelial (HBE) cells. (A) The cytotoxicity of the cigarette smoker extract (CSE) was measured by the CCK-8 kit (n = 4). HBE cells were cultured with different concentrations of CSE for 24 to 48 h. Gene expression of Adam9 was measured in HBE cells after 24 h (n = 5) (B) or 48 h (n = 5) (C). (D) Gene expression of Adam9 in HBE cells treated with 5% CSE (n = 4). (E) Gene expression of Il17a in HBE cells after 24 h CSE treatment (n = 4). (F–H) Immunoblot and densitometric analysis of ADAM9 and IL-17A in CSE-treated HBE cells (n = 6). (I–K) Immunoblot and densitometric analysis of ADAM9 and IL-17A at 0 to 24 h after CSE treatment (n = 4). *p < 0.05, **p < 0.01, ***p < 0.001, ****p < 0.0001.
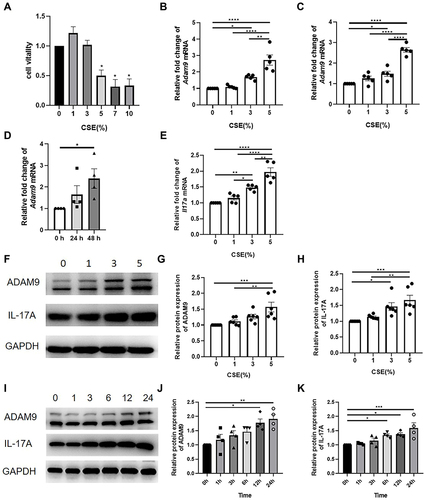
Figure 5 ADAM9 expression is upregulated by IL-17A in human bronchial epithelial (HBE) cells. (A) The cytotoxicity of different concentrations of recombinant human IL-17A with or without cigarette smoker extract (CSE) to HBE cells was measured by CCK-8 assay (n = 3). (B) Transcription of Adam9 was measured in HBE cells treated with different concentrations of IL-17A for 24 h (n = 5). (C) Transcription of Adam9 was increased with the supplement of 50 ng/mL recombinant human IL-17A cytokine with or without 3% CSE (n = 4). (D–G) Representative Western blot analysis of ADAM9 in IL-17A (n = 5) and/or CSE-treated HBE cells (n = 4). (H and I) Representative Western blot analysis of ADAM9 in IL-17A neutralizing antibody and/or CSE-treated HBE cells (n = 5). *p < 0.05, **p < 0.01, ***p < 0.001, ****p < 0.0001, ns, no significant difference.
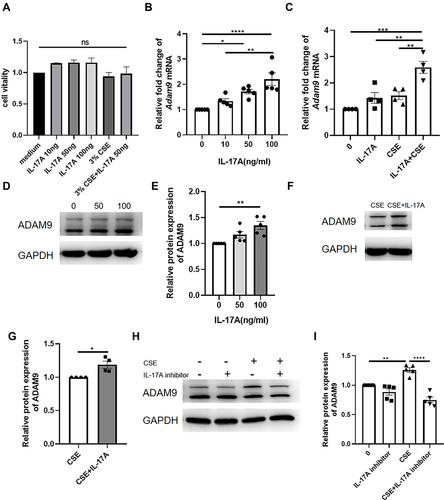
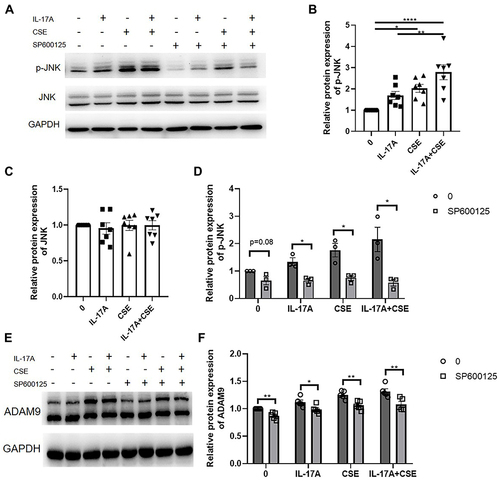
Figure 6 Activation of JNK signaling by IL-17A induces ADAM9 expression in human bronchial epithelial (HBE) cells. (A–D) Protein expression of JNK and p-JNK were examined in HBE cells treated with 50 ng/mL IL-17A with or without 3% cigarette smoker extract (CSE) for 10 min (n = 7). JNK inhibitor (SP600125, 10 µM) was added to inhibit JNK phosphorylation 1 h before the addition of IL-17A or CSE (n = 3). (E and F) HBE cells were treated with SP600125 for 1 h and then treated with IL-17A and/or CSE for 24 h. The expression of ADAM9 was examined by Western blot analysis (n = 5). *p < 0.05, **p < 0.01, ****p < 0.0001.