Figures & data
Figure 1 Attrition chart of patient selection.
Abbreviation: COPD, chronic obstructive pulmonary disease.
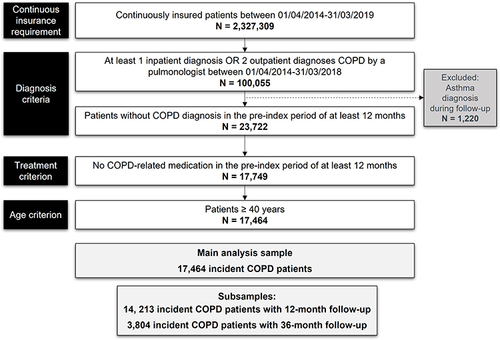
Table 1 Characteristics of the Identified Incident COPD Patients
Figure 2 Kaplan-Meier curves depicting the time to treatment initiation after incident COPD diagnosis.
Note: Censoring events: death or end of follow-up (31/03/2019).
Abbreviations: CI, confidence interval; COPD, chronic obstructive pulmonary disease; ICS, Inhaled glucocorticosteroids; LABA, long-acting beta-agonist; LAMA, long-acting muscarinic antagonist.
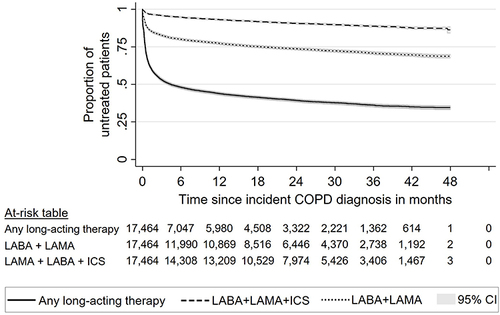
Figure 3 Frequency of inhaled maintenance therapies per line of treatment.
Notes: Only based on patients receiving either long-acting bronchodilators or ICS; a combination treatment was assumed if the respective agents were prescribed within a 60-days window and a similar prescription behavior was repeated at least once.
Abbreviations: ICS, inhaled glucocorticosteroids; LABA, long-acting beta-agonist; LAMA, long-acting muscarinic antagonist.
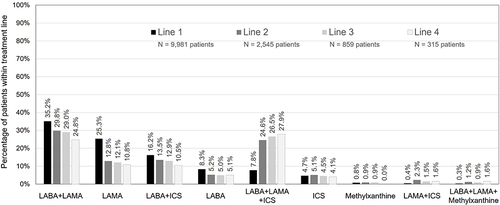
Figure 4 Treatment cascades observed after incident COPD diagnosis in a sample of patients with a follow-up of 36 months (n=3,804).
Notes: Other treatments include use of LABA alone, ICS alone, roflumilast and methylxanthines (alone or in combination with other therapies).
Abbreviations: ICS, inhaled glucocorticosteroids; LABA, long-acting beta-agonist; LAMA, long-acting muscarinic antagonist.
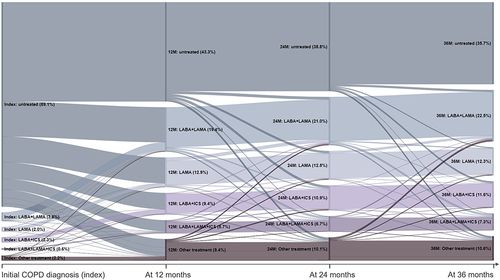
Figure 5 Kaplan-Meier curve depicting the time to first severe exacerbation (hospitalization with main diagnosis ICD-10GM code J44.1) after incident COPD diagnosis.
Note: Censoring events: death or end of follow-up (31/03/2019).
Abbreviations: CI, confidence interval; COPD, chronic obstructive pulmonary disease.
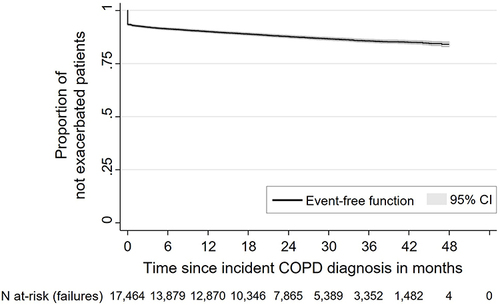
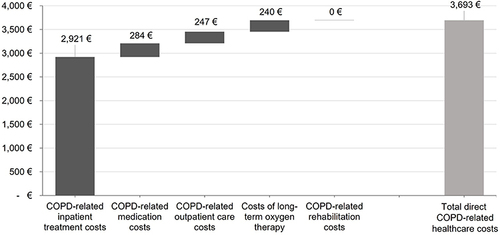
Figure 6 COPD-related direct healthcare cost per patient-year.
Abbreviations: CI, confidence interval; COPD, chronic obstructive pulmonary disease.