Figures & data
Table 1 Primer Sequences Information
Figure 1 Flow chart of the study design.
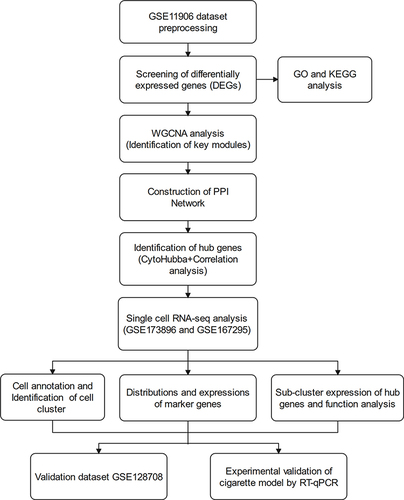
Figure 2 Identification of DEGs in GSE11906. (A and B) Volcano plot and heat map of DEGs. (C and D) GO functional annotation and KEGG enrichment analysis of DEGs.
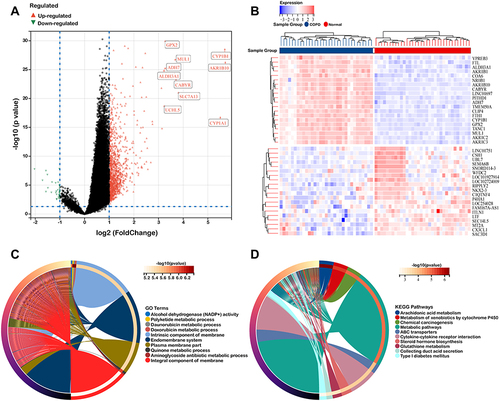
Figure 3 WGCNA network and module detection. (A) Scale Independence and mean network connectivity of soft-threshold power. A soft threshold of 7 is the optimal value. (B) Hierarchical clustering tree based on WGCNA. (C) Cluster dendrogram of differential genes represented the co-expression modules identified by WGCNA. (D) Module-trait weighted correlations and corresponding P values for the identified gene module and clinical features. (E) Correlation between gene significance of COPD, GOLD and smoking pack-year and module membership.
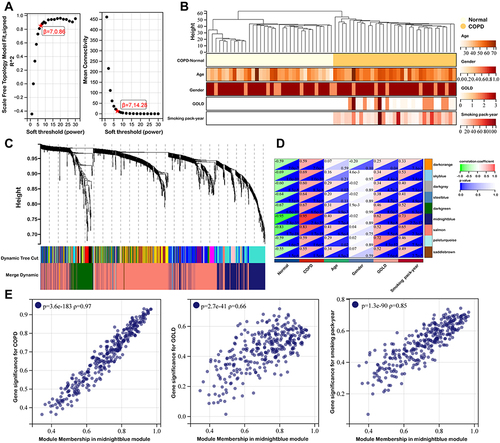
Figure 4 Identification of eight hub genes. (A) Protein-protein interaction network of 98 genes correlated with COPD clinical features were obtained from STRING database. (B) Top eight hub genes identified by Cytohubba. (C) Pearson correlation coefficient analysis of eight hub genes. (D) The relationship between hub gene and oxidative stress related genes. (E) Enrichment plot of Hallmark gene sets with eight hub genes.
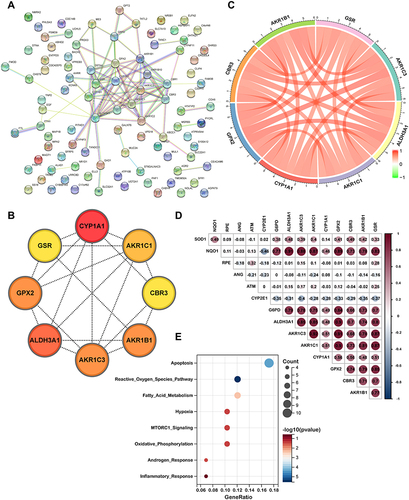
Figure 5 Profiling of cell types in COPD using scRNA seq data. (A) Uniform Manifold Approximation and Projection (UMAP) representation of 25,194 cells from 3 COPD and 3 control donor lungs. (B) Visualization of clustering by UMAP plot with 13 distinct cell types identified. (C) Relative proportion of each cell subset between normal and COPD tissues. (D) UMAP plot of epithelial cells colored according to identified clusters. (E) Violin plots of normalized expression values for canonical cell specific marker genes for alveolar epithelial cell type 1, alveolar epithelial cell type 2, basal cells, ciliated cells and goblet cells.
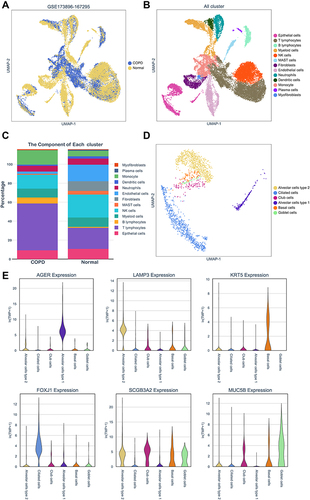
Figure 6 Hub genes expressions in COPD epithelial cells. (A) Hub genes expressions in epithelium were assessed by scRNA-seq from COPD and non-smokers. (B) Hub genes expressions in pulmonary epithelial cell subpopulations. (C) Gene-wise correlation heatmap of six hub genes. (D) Distribution and expression levels of hub genes in epithelial cells of COPD patients.
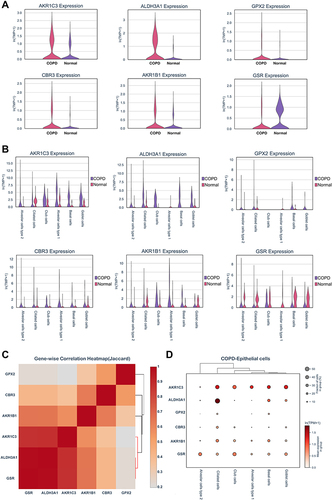
Figure 7 Single-cell RNA transcriptomic analysis of ALDH3A1 in epithelium. (A and B) Partition-based graph abstraction (PAGA) indicated ALDH3A1 was related to ciliated cells. (C) volcano plots of DEGs between ALDH3A1+ ciliated cells and ALDH3A1- ciliated cells. (D) KEGG pathway enrichment analysis of DEGs in ALDH3A1 ± ciliated cells.
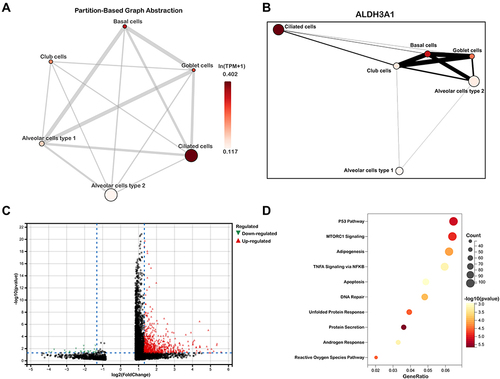
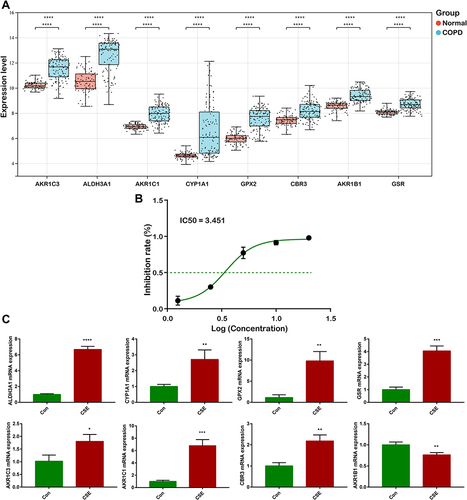
Figure 8 Verification of hub genes. (A) External validation of eight hub genes in GSE128708. (B) IC50 of cigarette smoke extract. (C) mRNA expression levels of eight hub genes were detected via RT-qPCR (*P<0.05, **P<0.01, ***P<0.001, ****P<0.0001).