Figures & data
Figure 1 (A) LEOSound-recorder with three body microphones (1) and an integrated ambient microphone (2). The size of the body microphone has been displayed. (B) Illustration of how to wear the recorder during the observation. The Figure depicts the position if the tracheal microphone (blue) and the two bronchial microphones (red and yellow). The recorder was worn with one strap around the neck and one around the chest.
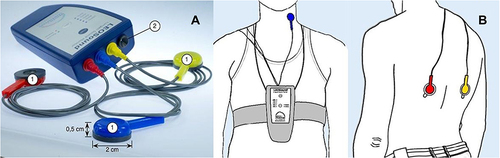
Figure 2 The user interface of the LEOSound-Analyzer is divided into two major fields - shown as Event Screen and Epochal View. The Event Screen displays the breathing rate (blue line), the detected coughing events (shown in green) and the wheezing rate of the associated epoch (shown in red). In the Epochal View the selected epochs in this example. The Event Screen is displayed as a spectrogram. Optionally, the epochs can also be represented as a loudness level.
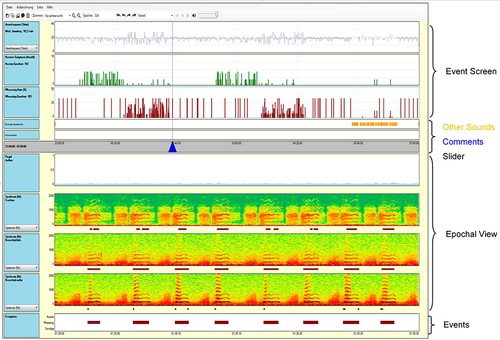
Table 1 Anthropometric Data of Study Cohort (n=14)
Figure 3 Percentage of wheezing during the 4 measurement nights. Percentages of wheezing on the 4 recording nights. Nights 1 to 6 correspond to the in-hospital nights following an AECOPD; night 20 describes an ambulatory overnight recording post-AECOPD. The trend of the acute phase (night 1 to night 6) was shown with an arrow.
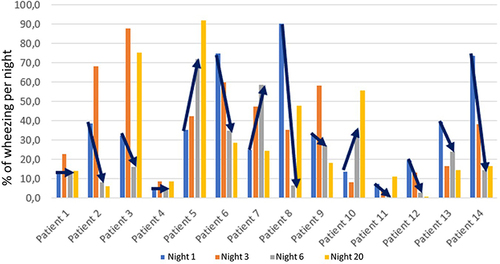
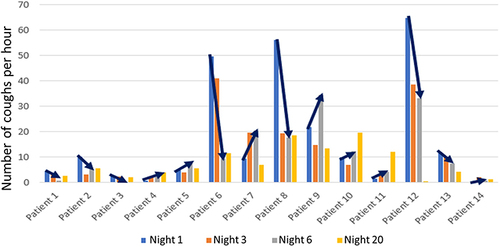
Figure 4 Number of coughs during the 4 measurement nights. Number of coughs on the 4 recording nights. Nights 1 to 6 correspond to the in-hospital nights following an AECOPD; night 20 describes an ambulatory overnight recording post-AECOPD. The trend of the acute phase (night 1 to night 6) was shown with an arrow.