Figures & data
Figure 1 Flow chart for participants included in the analysis of relationship between BMI and lung function.
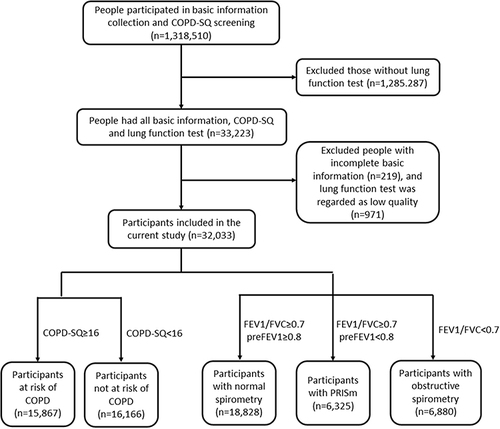
Table 1 Characteristics of Participants Included in the Analysis of Relationship Between BMI and Lung Function
Table 2 The Relationship Between BMI and Lung Function According to COPD-SQ Scores
Figure 2 The relationship between BMI and lung function according to COPD-SQ scores. (A) The relationship between BMI and lung function in people at risk of COPD. (B) The relationship between BMI and lung function in people not at risk of COPD.
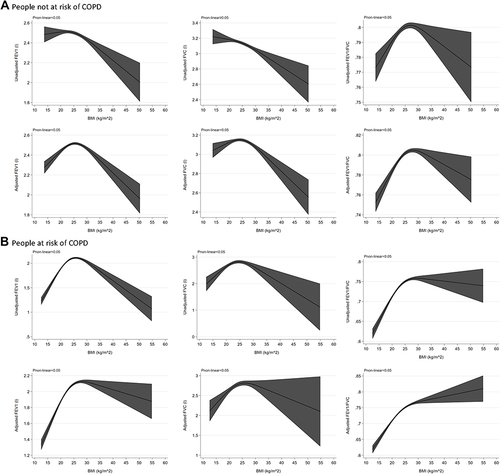
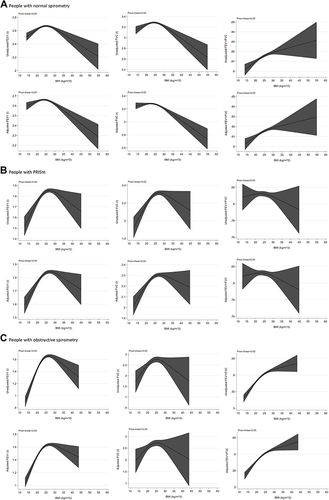
Table 3 The Relationship Between BMI and Lung Function According to Lung Function Test
Figure 3 The relationship between BMI and lung function according to lung function test. (A) The relationship between BMI and lung function in people with normal spirometry. (B) The relationship between BMI and lung function in people with PRISm. (C) The relationship between BMI and lung function in people with obstructive spirometry.