Figures & data
Table 1 Demographics of healthy individuals providing plasma samples
Figure 1 Concentrations of A1AT, ferritin, and transferrin among MM, MZ, and ZZ cohorts. Relative to the MM genotype, significant decrements in plasma A1AT concentrations were observed in both MZ and ZZ subjects (A). Relative to MM subjects, plasma ferritin levels were significantly increased only in the ZZ cohort (B). Transferrin did not demonstrate differences between the three genotypes (C).
Abbreviation: A1AT, α-1 antitrypsin.
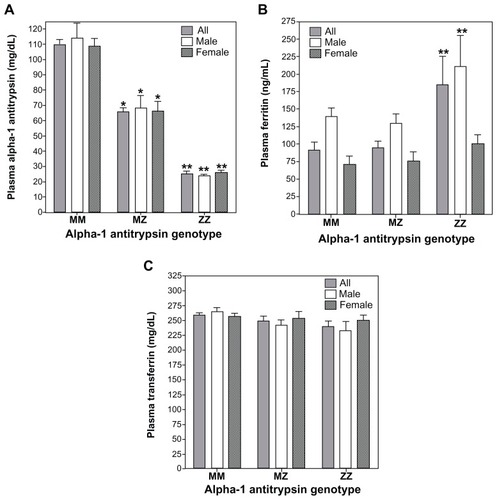
Figure 2 Linear correlations between plasma concentrations of A1AT, ferritin, and transferrin. The correlation between A1AT and ferritin concentrations (A) reached significance while that between A1AT and transferrin (B) did not. The relationship between plasma ferritin and transferrin was negative and significant (C).
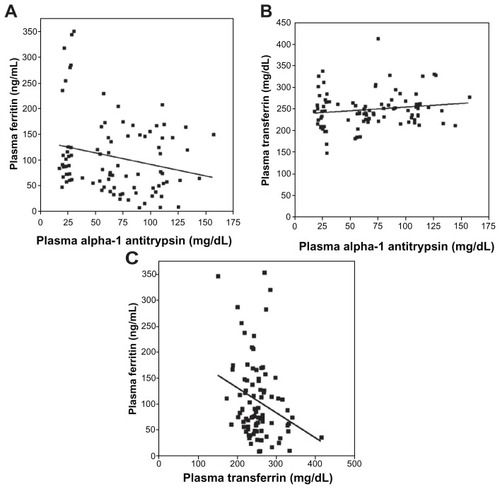
Figure 3 C-reactive protein (CRP) levels in MM, MZ, and ZZ individuals and its correlation with A1AT concentration. There were no significant differences in CRP among the MM, MZ, and ZZ genotypes (A). Similarly, there was no significant correlation between plasma A1AT and CRP concentrations (B).
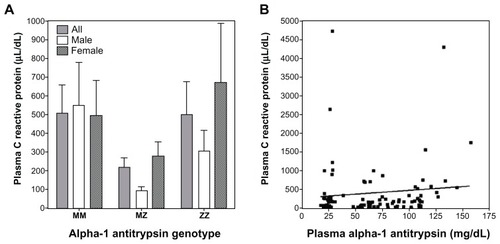
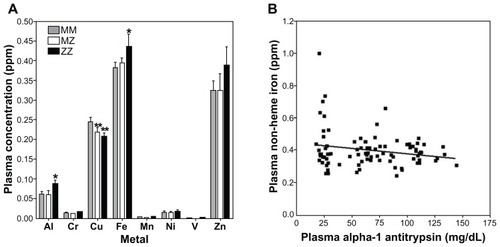
Figure 4 Plasma metal concentrations among MM, MZ, and ZZ cohorts. Aluminum and iron concentrations were observed to increase in ZZ individuals relative to those with MM and MZ genotype (A). In contrast, copper levels decreased in both MZ and ZZ cohorts (A). Only the correlation between A1AT and iron concentration was significant (B).
Abbreviation: A1AT, α-1 antitrypsin.