
Figures & data
Table 1 Patient Demographics by Readmission Status
Figure 1 (A) ROC curves of 90-day readmission risk random forest model and HOSPITAL score. (B) ROC curve of 90-day readmission cause model.
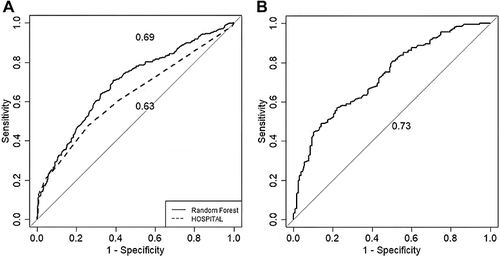
Figure 2 Important variables in 90-day readmission risk model.
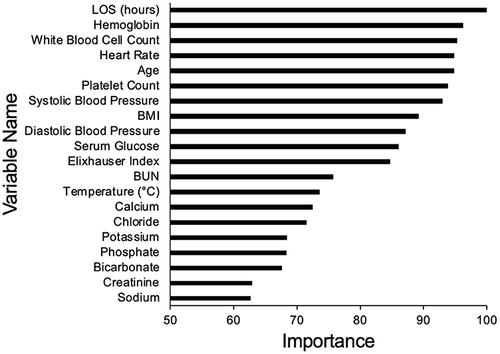
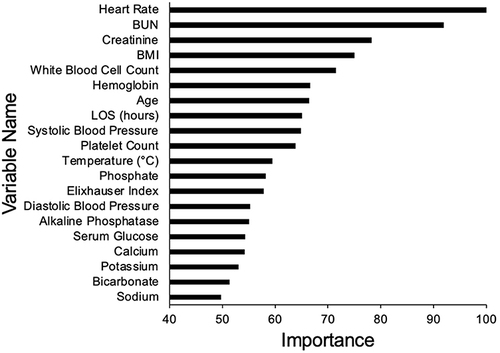
Figure 3 Important variables in 90-day readmission cause model.
Data Availability Statement
Since these data are highly granular and contains potentially sensitive patient information, public sharing of the data would breach the University of Chicago’s IRB protocol requirements. The data used in this study was accessed in a way that was compliant with relevant data protection and privacy regulations per the University of Chicago’s IRB (IRB #17-0332). Interested researchers may contact Mary Akel, University of Chicago, via email at [email protected] for data access requests.