Figures & data
Table 1 Baseline Description of the Population
Table 2 Patients’ Reported Cardiovascular and Metabolic Comorbidities
Figure 1 Flowchart of the whole population.
Abbreviation: PR, pulmonary rehabilitation.
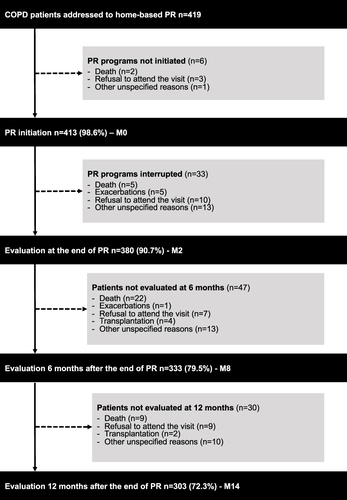
Table 3 Absolute Variations of Exercise Capacity, Quality of Life and Anxiety-depression for each Group of Patients
Table 4 Absolute Variations of Exercise Capacity, Quality of Life and Anxiety-depression for the Whole Population
Table 5 Comparisons to Baseline of Exercise Capacity, Quality of Life and Anxiety-depression Assessed at the End of the Rehabilitation Program and after 6 and 12 Months for each Group of Patients
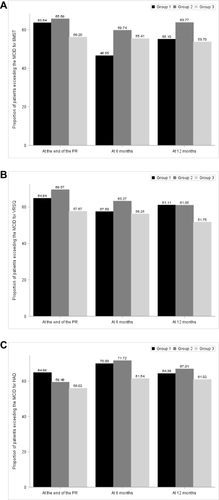
Figure 2 Proportion of patients exceeding the MCID for exercise capacity, quality of life and anxiety-depression score according to the group.
Notes: Proportion of patients exceeding the MCID for exercise tolerance assessed by (A) the 6-min stepper test (6MST – MCID 40 steps), (B) quality of life assessed by the visual simplified respiratory questionnaire (VSRQ – MCID 3.4 points) and (C) anxiety-depression assessed by the hospital anxiety and depression scale global score (HAD – MCID 1.5 points). Group 1, Reference Group; Group 2, Metabolic Group; Group 3, Cardiovascular Group.
Abbreviations: 6MST, 6-min stepper test; HAD, hospital anxiety and depression scale; MCID, minimal clinically significant difference; VSRQ, visual simplified respiratory questionnaire.