Figures & data
Table 1 Clinical Diagnoses and Demographic Characteristics of Participants
Figure 1 Sodium dodecyl sulfate-polyacrylamide gel electrophoresis. Lane M contains markers. Lanes 1–3 are proteins without the highly abundant proteins obtained from serum samples of healthy controls. Lanes 4–8 are proteins without the highly abundant proteins obtained from serum samples of patients with acute COPD, whereas lanes 9–11 are proteins without the highly abundant proteins obtained from serum samples of patients with stable COPD.
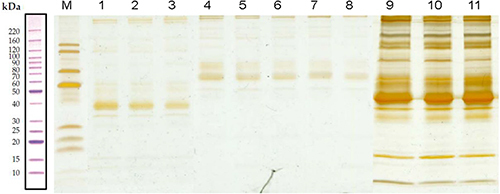
Table 2 Serum Proteins Differentially Expressed Between Patients with Acute Exacerbation of COPD and Healthy Control Participants
Table 3 Serum Proteins Differentially Expressed Between Patients with Stable COPD and Healthy Control Participants
Figure 2 Differentially expressed proteins (DEPs). (A and C) Volcano plots showing upregulated proteins represented by red dots, downregulated proteins represented by green dots, proteins with no significant represented by black dots (absolute log10 fold change and P < 0.05 as the standard) between the group with acute exacerbation of COPD and the healthy control group (A), and between the group with stable COPD and the healthy control group (C). (B and D) Heat map showing the clustergram of the upregulated and downregulated DEPs between the acute COPD group ((B): a, 4–8) and the healthy control group ((B): b, 1–3), and between the stable COPD group ((D): a, 9–11) and the healthy control group ((D): b, 1–3). Each row represents a protein, each column represents a sample, and colors represent different levels of expression (log2 values of quantitative values are median-corrected during heat mapping).
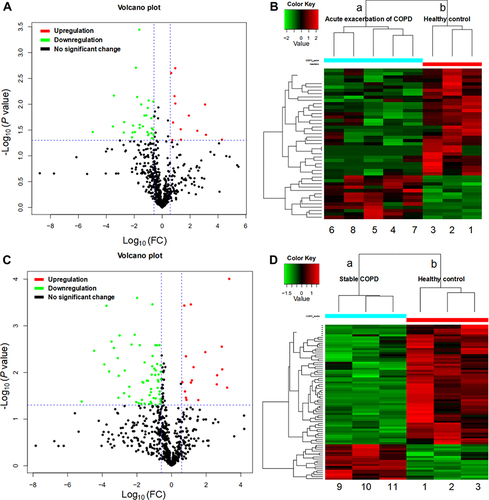
Figure 3 Gene ontology (GO) functional annotation. Upregulated and downregulated proteins in the GO categories of biological processes, cellular components, and molecular functions between the group with acute exacerbation of COPD and the healthy control group (A), and between the group with stable COPD and the healthy control group (B).
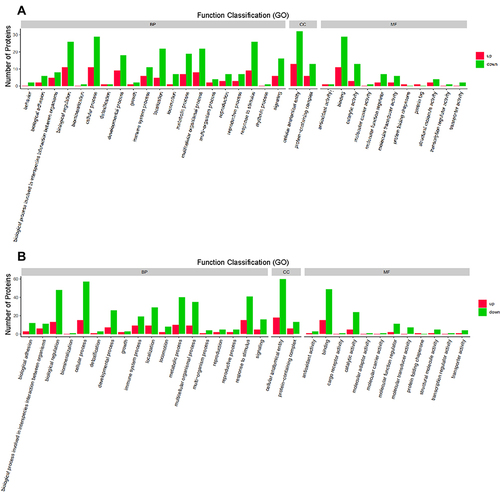
Figure 4 Gene ontology (GO) functional enrichment. Enriched GO terms and the associated numbers of proteins between the group with acute exacerbation of COPD and the healthy control group (A), and between the group with stable COPD and the healthy control group (B). The circle size represents the number of differentially expressed proteins in the GO term. The circle color indicates the -log10 P value representing the significant degree of enrichment.
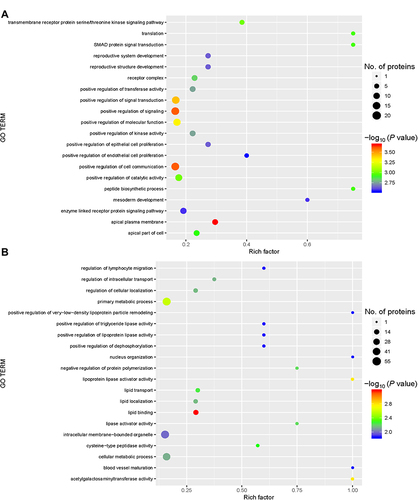
Figure 5 Kyoto Encyclopedia of Genes and Genomes (KEGG) pathway enrichment. KEGG pathways enriched for the upregulated and downregulated proteins and the associated numbers of proteins between the group with acute exacerbation of COPD and the healthy control group (A), and between the group with stable COPD and the healthy control group (B).
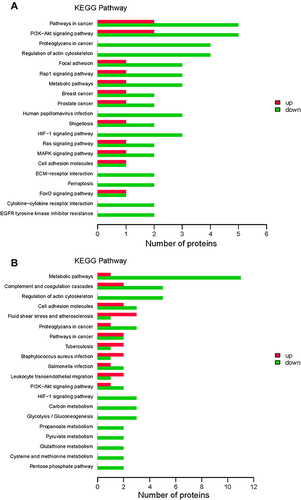
Figure 6 Kyoto Encyclopedia of Genes and Genomes (KEGG) pathway annotation. KEGG pathway annotation for the upregulated and downregulated proteins and the associated number of protein between the group with acute exacerbation of COPD and the healthy control group (A), and between the group with stable COPD and the healthy control group (B). The circle size represents the number of differentially expressed proteins in the GO term. The circle color indicates the −log10 P value representing the significant degree of enrichment.
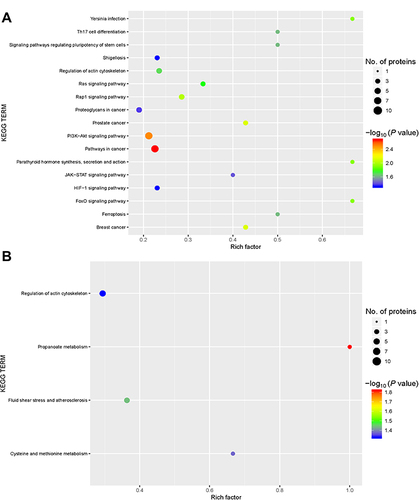
Figure 7 Clusters of Orthologous Groups (COGs) annotated for differentially expressed proteins. COG annotation for the upregulated and downregulated proteins and their associated frequency between the group with acute exacerbation of COPD and the healthy control group (A), and between the group with stable COPD and the healthy control group (B). The x-axis represents the functional class in the COG database. The y-axis represents the frequency of each functional class.
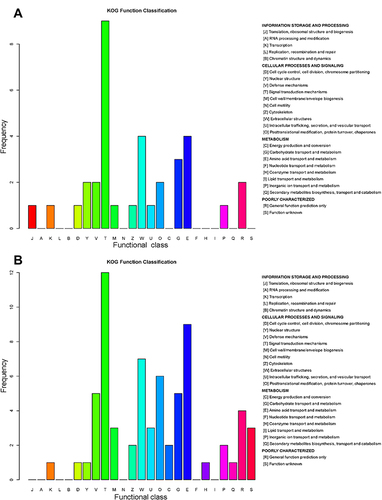
Table 4 Demographic and Biomarker Data of Patients Used for ELISA
Figure 8 Comparison of biomarker levels between patients with acute exacerbation of COPD and healthy control participants. The horizontal axis represents the healthy control group and the group with acute exacerbation of COPD. The y-axis indicates the concentration of biomarker. Values are shown as median with interquartile range; n = 30. *P < 0.005 indicates a significant difference for the healthy control group (Non-COPD) vs the group with acute exacerbation of COPD analyzed by Mann–Whitney U-test.
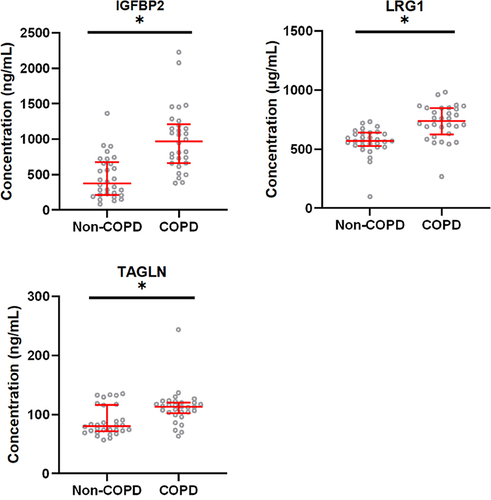
Table 5 Biomarker Levels in Patients with Acute Exacerbation of COPD and Healthy Control Participants
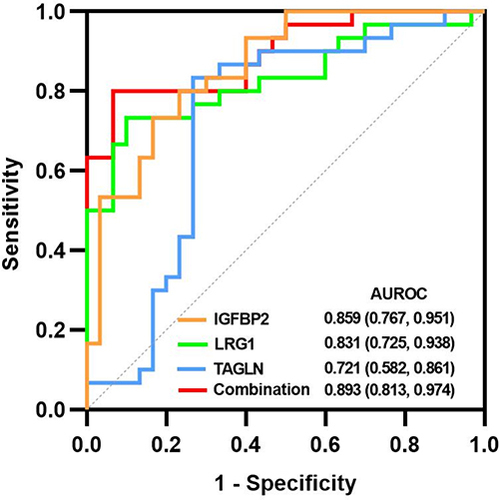
Figure 9 The receiver operating characteristic curves of these biomarkers.