
Figures & data
Table 1 Patient Characteristics
Table 2 Changes in Lung Volumes in Plethysmography Measurements After PR
Figure 1 A graph showing the parameters for which statistically significant differences were observed in patients who has participated in an eight-weeks PR program.
Abbreviations: PR, pulmonary rehabilitation; sRawtot, total specific resistance of airways; sGawtot, total specific conductance of airways; ΔSaO2, delta of haemoglobin O2 saturation; mMRC, modified Medical Research Council; CAT, COPD assessment test.
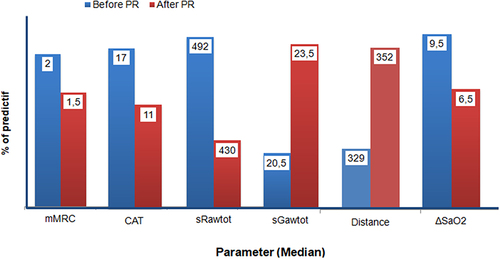
Figure 2 A Body plethysmography data samples of a 57-year-old male patient with a history of smoking 60 pk/year, who has attended sixteen sessions (8 weeks) of PR program; before attending (A) and after attending (B).
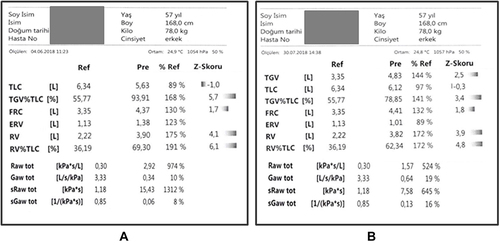
Table 3 Comparison of 6-MWT Data