Figures & data
Table 1 Baseline demographic data for patients with chronic obstructive pulmonary disease
Figure 1 Study design.
Notes: Patients fixed the Lifecorder to their belts for a period of 4 weeks without receiving indacaterol therapy and then for another period of 4 weeks while receiving 150 μg of inhaled indacaterol.
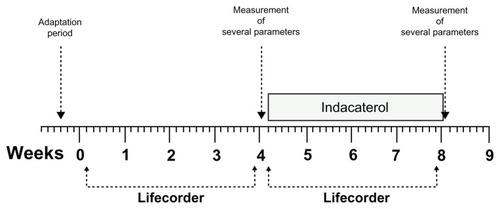
Figure 2 Response to indacaterol. Maximum inspiratory capacity (A), FEV1 (B), and 6MWT (C) improved significantly after 4 weeks of treatment with indacaterol. The CAT score (D) tended to decrease after treatment with indacaterol.
Notes: Horizontal bars indicate the means. Statistical analysis was performed using the nonparametric Wilcoxon’s rank test.
Abbreviations: 6MWT, six-minute walk test; CAT, COPD Assessment Test; FEV1, forced expiratory volume in one second.
Abbreviations: 6MWT, six-minute walk test; CAT, COPD Assessment Test; FEV1, forced expiratory volume in one second.
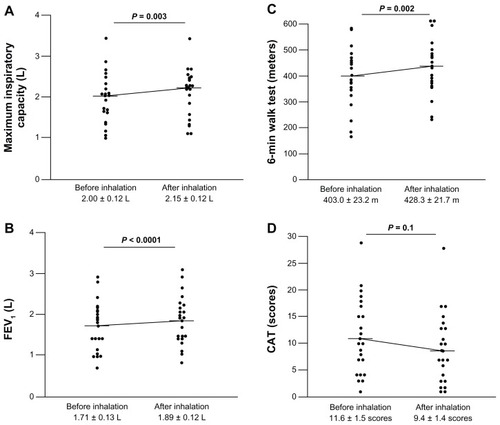
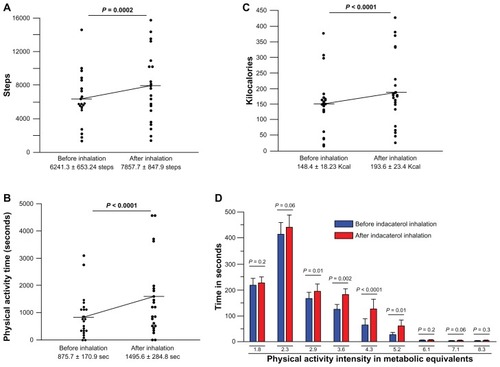
Figure 3 Effect of indacaterol on physical activity parameters. Number of steps (A), duration of moderate or more exercise (B), energy expenditure (C) and metabolic equivalent of task (D) improved significantly after treatment with indacaterol in all patients.
Notes: Horizontal bars indicate the means. Statistical analysis was performed using the nonparametric Wilcoxon’s rank test.