Figures & data
Figure 1 Lung function assessment after smoke exposure and treatment with caspase-1 inhibitor Z-VAD-fluoromethylketone or the caspase-3 inhibitor Ac-DEVD-CHO. (A) Airway resistance was higher in the Smoke group and lower in the Z-VAD group but with P value >0.05. (B) Dynamic lung compliance decreased in Smoke group and increased in the Z-VAD group compare with the control. (C) MVV were lower in the Smoke group. Values are mean ± SD for airway resistance and MVV. Values are quartiles for dynamic lung compliance, and n = 6, 6, 5, and 7 for each group. *P < 0.05.
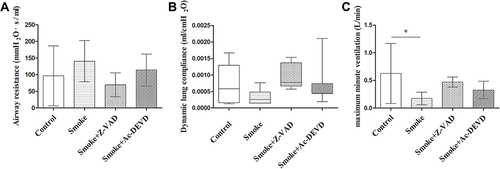
Figure 2 Representative photomicrographs of hematoxylin and eosin staining of lung sections (original magnification × 40, 100, and 400). (⇧) Arrowheads represent pulmonary emphysema. (☆) represent exudates. (∆) represent inflammatory cell infiltration. (◊) represent epithelial proliferation. Control group (A-C) normal lung tissues. Smoke group (D-F) inflammation and pulmonary emphysema. Z-VAD group (G-I) reduced inflammation and emphysema than the smoke group. Ac-DEVD group (J-L) reduced inflammation than the smoke group.
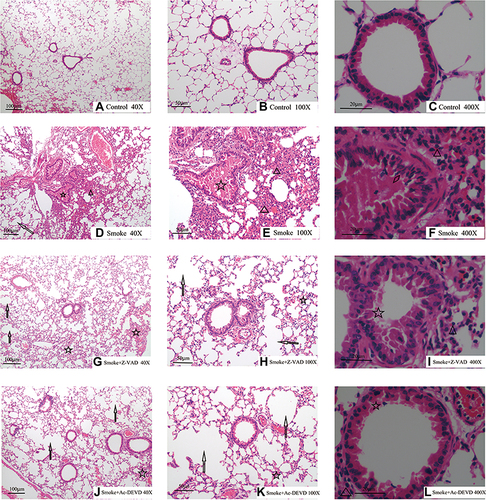
Figure 3 The average alveolar intercept in the corresponding groups. The AAI was shorter in the control group than in the other three groups, and it was shorter in the Z-VAD group than in the Smoke group, but it was not significantly shorter in the Ac-DEVD group than in the Smoke group. Data are expressed as quartiles, and n = 8, 8, 6, and 8 for each group. *P < 0.05, **P < 0.01, and ***P < 0.001.
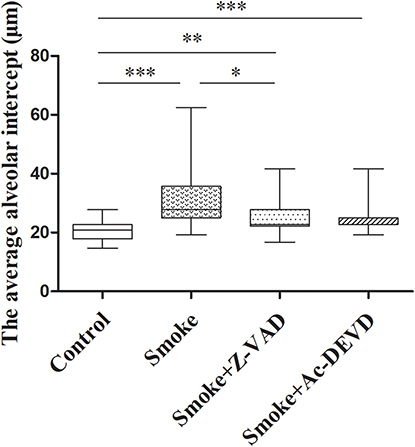
Figure 4 Inflammatory factor in serum and bronchoalveolar lavage fluid. IL-1β and IL-8 were detected using an enzyme-linked immunosorbent assay: (A) IL-1β in serum; (B) IL-1β in and bronchoalveolar lavage fluid (BALF); (C) IL-8 in serum; and (D) IL-8 in BALF. The results are expressed as mean ± SD, n = 5, 6, 5, and 7 for serum and n = 6, 5, 5, and 8 for BALF. *P < 0.05, **P < 0.01, and ***P < 0.001.
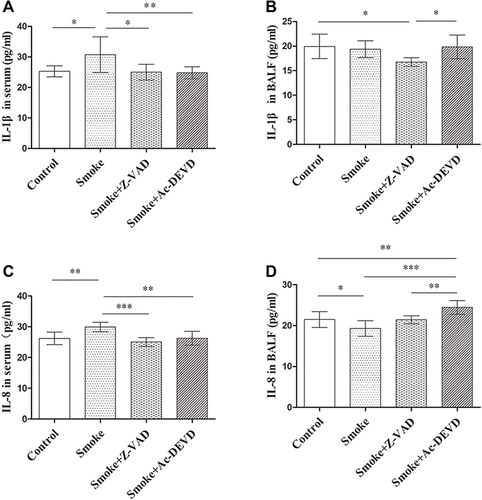
Figure 5 Sections were stained with periodic acid-Schiff. (A-C) the control group; (D-F) the Smoke group; (G-I) the Z-VAD group; (J-L) the Ac-DEVD group. (⇧) Arrowheads represent pulmonary emphysema.
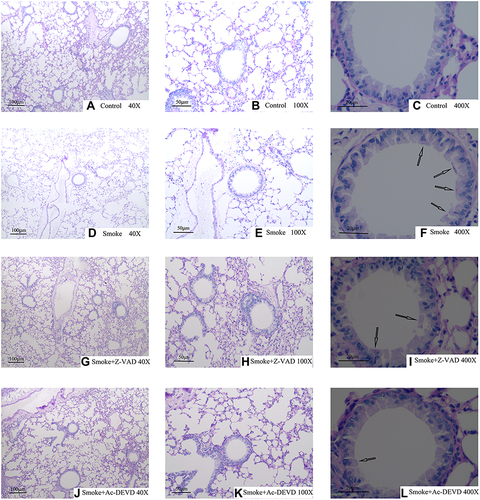
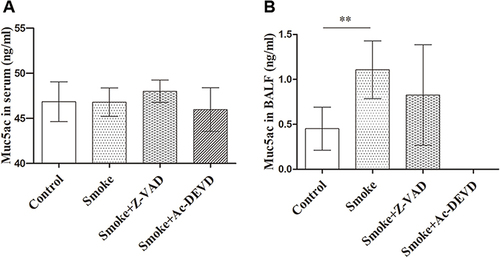
Figure 6 Mucin 5ac measurements in serum and bronchoalveolar lavage fluid. Mucin 5ac were detected using an enzyme-linked immunosorbent assay. (A) Muc5ac in serum. There were no significant differences in serum Muc5ac expression between the groups. (B) Muc5ac in BALF. Muc5ac in Smoke group was higher than other groups. The data are expressed as mean ± SD, n = 5, 6, 5, and 7 for serum and n = 6, 5, 5, and 8 for bronchoalveolar lavage fluid. **P < 0.01.