Figures & data
Table A1 Permitted medications and medication restrictions
Table 1 Summary of study patient demographics
Figure 1 Study population.
Notes: Five randomized patients did not proceed with treatment: three patients decided to not participate, one patient developed a COPD exacerbation, and one patient was unable to stop prohibited medication prior to randomization.
Abbreviations: N, number; CVT-R, ipratropium bromide/albuterol Respimat inhaler; CVT-MDI, ipratropium bromide/albuterol metered-dose inhaler; I+A, ipratropium bromide and albuterol metered dose inhalers delivered as dual monotherapies; AE, adverse event.
Abbreviations: N, number; CVT-R, ipratropium bromide/albuterol Respimat inhaler; CVT-MDI, ipratropium bromide/albuterol metered-dose inhaler; I+A, ipratropium bromide and albuterol metered dose inhalers delivered as dual monotherapies; AE, adverse event.
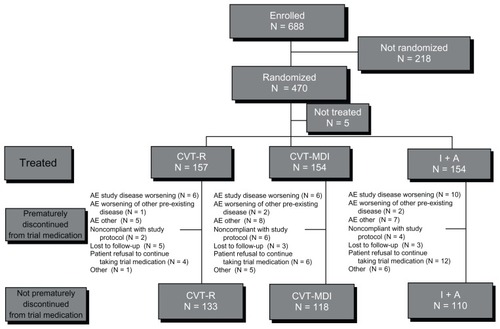
Figure 2 Kaplan–Meier curves of time to discontinuation.
Abbreviations: CVT-R, ipratropium bromide/albuterol Respimat inhaler; CVT-MDI, ipratropium bromide/albuterol metered-dose inhaler; I + A, ipratropium bromide and albuterol metered dose inhalers delivered as dual monotherapies; d, days.
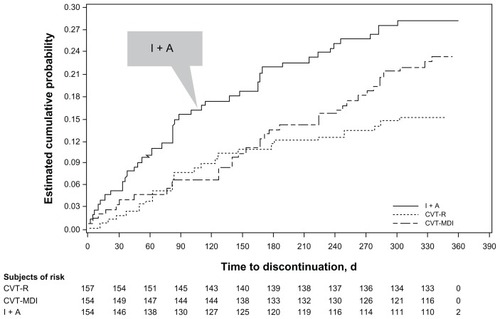
Figure 3 Adjusted mean of PASAPQ performance domain score time profile.
Abbreviations: PASAPQ, Patient Satisfaction and Preference Questionnaire; CVT-R, ipratropium bromide/albuterol Respimat inhaler; CVT-MDI, ipratropium bromide/albuterol metered-dose inhaler; I + A, ipratropium bromide and albuterol metered dose inhalers delivered as dual monotherapies.
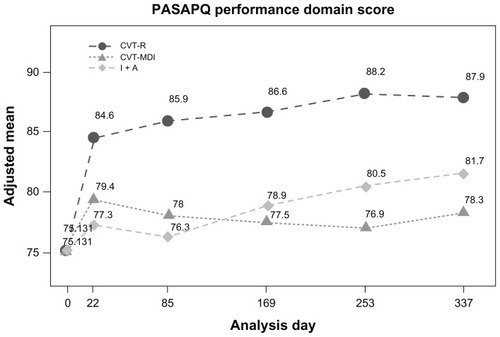
Figure 4 Kaplan-Meier curves for time to first COPD exacerbation.
Abbreviations: COPD, chronic obstructive pulmonary disease; CVT-R, ipratropium bromide/albuterol Respimat inhaler; CVT-MDI, ipratropium bromide/albuterol metered-dose inhaler; I+A, ipratropium bromide and albuterol metered dose inhalers delivered as dual monotherapies; d, day.
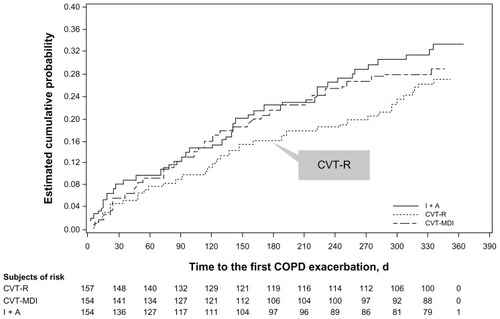
Table 2 Frequency of patients (N, %) with adverse events occurring with incidence in preferred term greater than or equal to 3% by treatment, primary system organ class, and preferred term