Figures & data
Figure 1 Study flowchart.
Abbreviations: NHANES, National Survey of the National Center for Health Statistics; FVC, forced vital capacity; FEV1, forced expiratory volume in the first 1 second; LDH, serum lactate dehydrogenase; BMI, body mass index; CVD, cardiovascular diseases; MCV, mean corpuscular volume; FEV1% predicted, forced expiratory volume in 1 second percent of predicted.
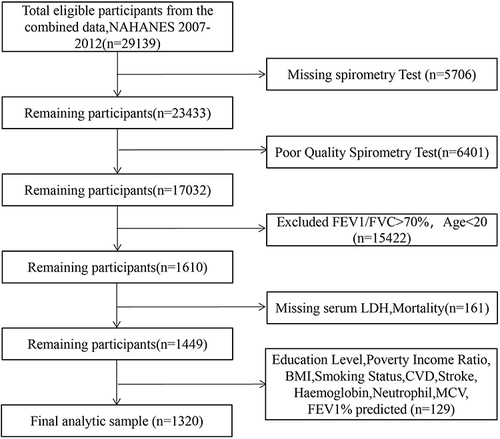
Table 1 Baseline Characteristics of the Study Participants
Table 2 Univariate Analysis of Risk Factor Associated with All-Cause Mortality in Patients with COPD
Table 3 Multivariate Cox Regression for LDH on All-Cause Mortality of COPD
Table 4 The Non-Linear Relationship Between Serum LDH and All-Cause Mortality
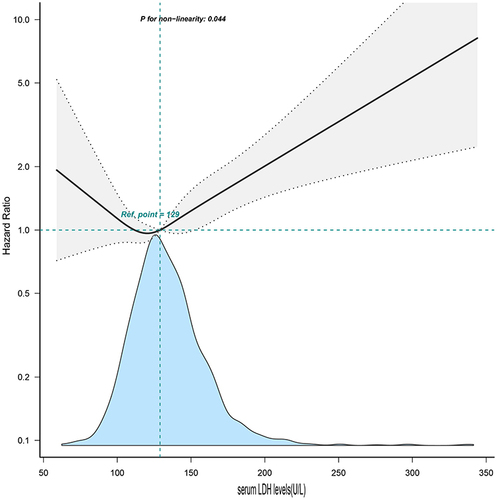
Figure 2 Association between serum LDH levels and all-cause mortality after adjusted for Model III. Adjusted for age + sex + race + education + poverty income ratio + BMI + smoking status + diabetes + hypertension + CVD + stroke + cancer + ALT + ALB + neutrophil + hemoglobin + MCV + FEV1% predicted.
Note: The black and dotted lines represent the estimated values and their corresponding 95% confidence intervals, respectively.
Abbreviations: BMI, body mass index; CVD, cardiovascular disease; MCV, mean corpuscular volume; FEV1% predicted, forced expiratory volume in 1 second percent of predicted; ALT, alanine aminotransferase; ALB, albumin.