Figures & data
Figure 1 The sensors included in the RPM service are adhered to undergarments to address the burden involved in maintaining a clip-on or wrist-worn sensor, without requiring skin-adhesion.
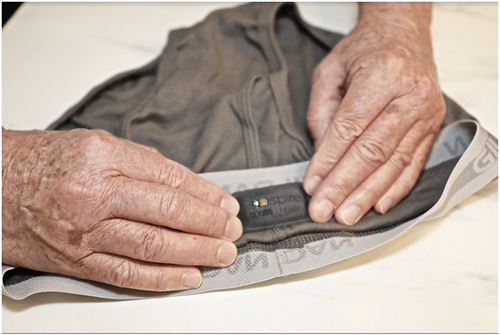
Figure 2 The hub passively captures sensor data and securely transmits it to the cloud. It provides limited feedback to patients.
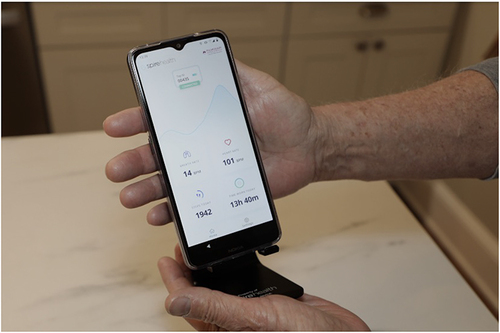
Table 1 The Risk Assessment Script
Table 2 Baseline Characteristics of Subjects
Table 3 Differences in Healthcare Utilization per Patient Pre- and Post-Initiation of RPM
Figure 3 Healthcare resource utilization outcomes pre- to post-initiation of RPM. Each bar is labeled with the absolute number of events.
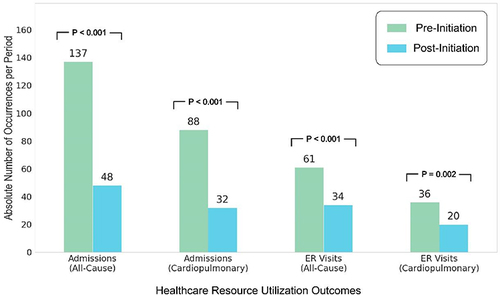
Table 4 Descriptive Statistics of Hospitalizations, All-Cause and Cardiopulmonary
Figure 4 Sankey graph where colored bins on the left represent groups of patients who experienced 0, 1, 2, or 3+ all-cause hospitalizations pre-initiation of RPM. The ribbons represent the flow of those patients to a bin representing the number of hospitalizations they experienced in the 12 months post-initiation. The numbers indicate numbers of patients in that subgroup.
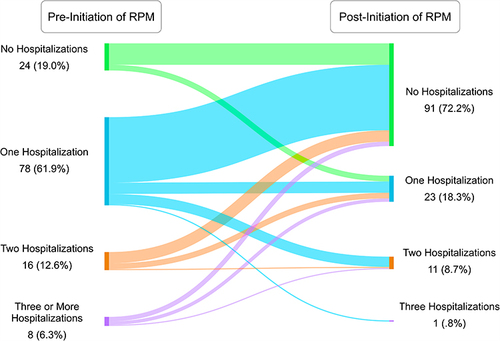
Figure 5 The mean RPM adherence values of the individual participants in the cohort across all months post-initiation of RPM.
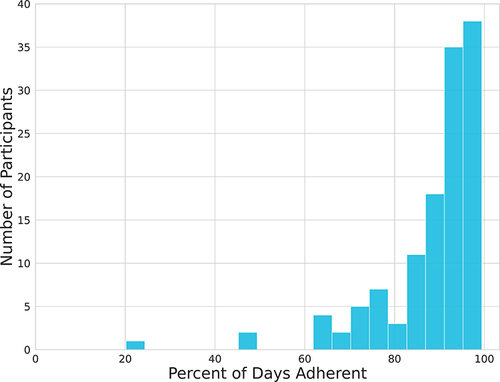
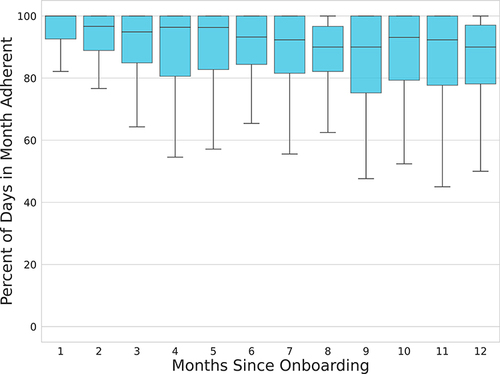
Figure 6 Boxplots showing the distribution of adherence rates to RPM for each month post-initiation. For each month, adherence is calculated as the proportion of days in which sensors were worn ≥8 hours.