
Figures & data
Figure 1 Flow chart describing the selection and data collection within the study.
Abbreviation: COPD, chronic obstructive lung disease.
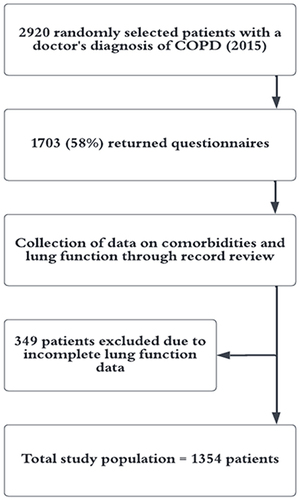
Table 1 Patient Characteristics
Table 2 Associations with the Non-Exacerbator COPD Phenotype
Figure 2 The non-exacerbator phenotype by severity of COPD proportions of patients with no exacerbations in every COPD stage.
Abbreviation: COPD, chronic obstructive lung disease.
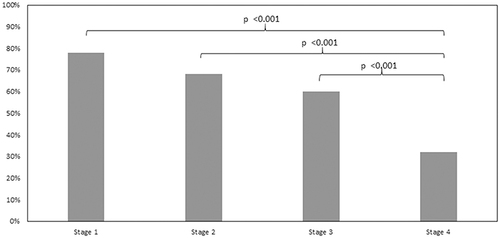
Figure 3 Factors associated with having no exacerbations in COPD results from multivariable analysis, adjusted for sex, age, smoking, level of education, BMI, COPD stage, CAT, chronic bronchitis, heart failure, ischemic heart disease, atrial fibrillation and depression/anxiety.
Abbreviations: BMI, body mass index; CAT, COPD assessment test; CB, Chronic bronchitis; HF, Heart failure.
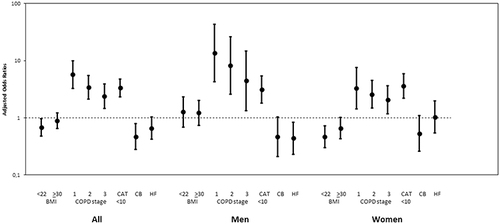
Table 3 Differences by Sex