Figures & data
Table 1 The Early Warning Score (EWS)
Table 2 Inpatient demographics, COPD severity, comorbidities, and performance statusTable Footnote
Table 3 Physiological measurements on admission
Table 4 Laboratory variables on admission
Table 5 Univariate analysis of variables associated with inpatient death
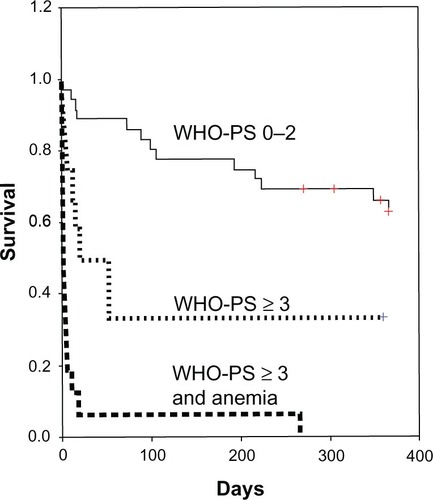
Figure 1 Kaplan–Meier curve of patient survival up to 1 year following hospital admission. The red crosses represent censored data.
Abbreviation: WHO-PS, World Health Organization performance status.