Figures & data
Figure 1 PRISMA Flow Chart.
Abbreviation: PRISMA, Preferred Reporting Items for Systematic Reviews and Meta-Analyses.
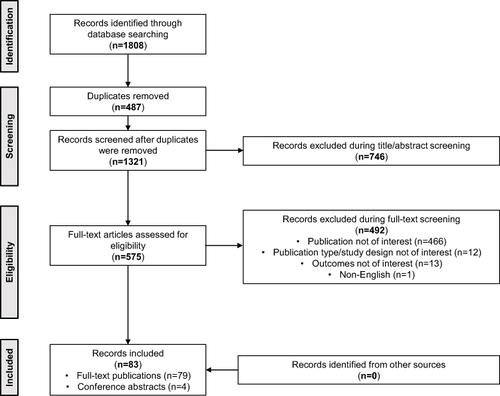
Figure 2 Percentage of Patients in GOLD A and GOLD B Groups Across Publications.
Abbreviation: GOLD, Global Initiative for Chronic Obstructive Lung Disease.
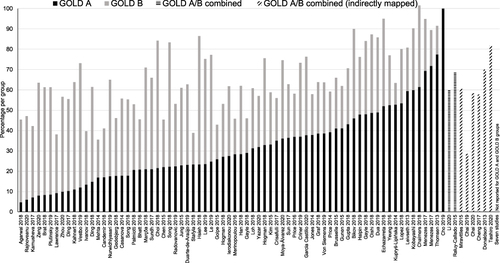
Figure 3 FEV1% Predicted Among Patients in GOLD A and GOLD B Groups Across Publications.
Notes: Scores are mean values unless otherwise stated; †Median scores.
Abbreviations: FEV1, forced expiratory volume in 1 second; GOLD, Global Initiative for Chronic Obstructive Lung Disease.
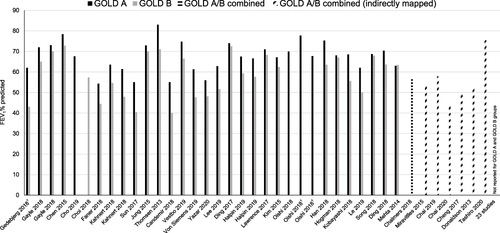
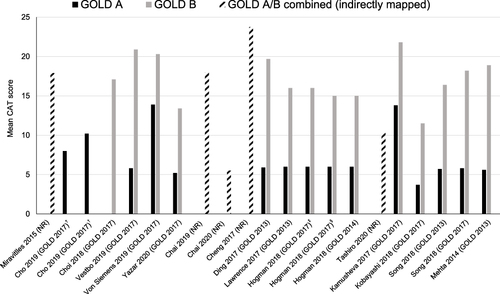
Figure 4 Distribution of Baseline CAT Score Among Patients in GOLD A and GOLD B Groups Across Publications.
Notes: †Cho 2019 reports CAT score for subgroups with and without regular treatment; ‡Hogman 2018 group C changing to group A with GOLD 2017: mean 6.0; group D changing to group B with GOLD 2017: mean 16.0; §Hogman 2018 group A remaining in group A GOLD 2017: mean 6.0; group B remaining in group B with GOLD 2017: mean 15.0. GOLD classification followed per study is shown in brackets (where reported).
Abbreviations: CAT, COPD Assessment Test; COPD, chronic obstructive pulmonary disease; GOLD, Global Initiative for Chronic Obstructive Lung Disease; NR, not reported; SD, standard deviation.