Figures & data
Table 1 Primers Sequences of Hub Genes and Internal Reference Genes
Figure 1 The differences in levels of MDSCs and Treg cells in the peripheral blood of COPD patients and healthy subjects. (A) Flow cytometric analysis of MDSCs in the peripheral blood of healthy subjects. (B) Flow cytometric analysis of MDSCs in the peripheral blood of COPD patients. (C) The counts of MDSCs in the peripheral blood of COPD patients and healthy subjects. (**P<0.01). (D) Flow cytometric analysis of Treg cells in the peripheral blood of healthy subjects. (E) Flow cytometric analysis of Treg cells in the peripheral blood of COPD patients. (F) The counts of Treg cells in the peripheral blood of COPD patients and healthy subjects. (****P<0.0001).
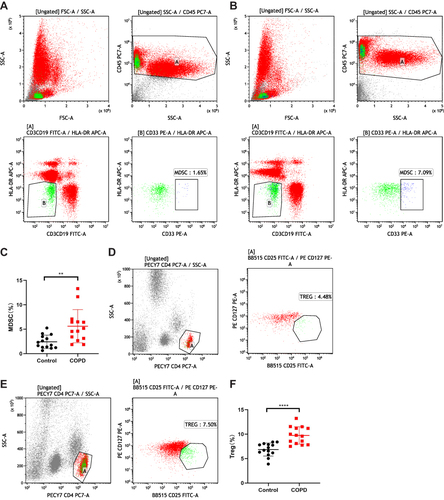
Figure 2 Continued.
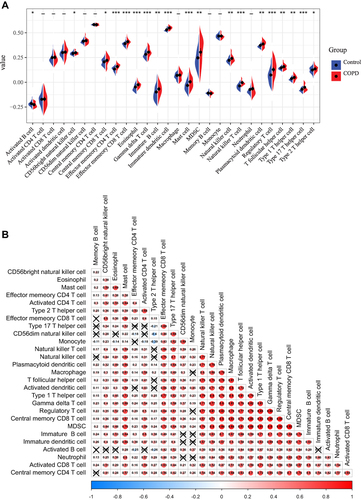
Figure 2 The difference and correlation of immune infiltration of COPD patients and healthy subjects. (A) The differences in 28 immunocytes in the airway tissues of COPD patients and healthy subjects. (*P<005, **P<0.01, ***P<0.001). (B) The correlation of 28 immunocytes in the airway tissues of COPD patients and healthy subjects. (C) The differences in immunocytes in the peripheral blood of COPD patients and the healthy subjects as analyzed by immune infiltration scoring. (*P<0.05, **P<0.01). (D) The correlation of immunocytes in the peripheral blood of COPD patients and healthy subjects.
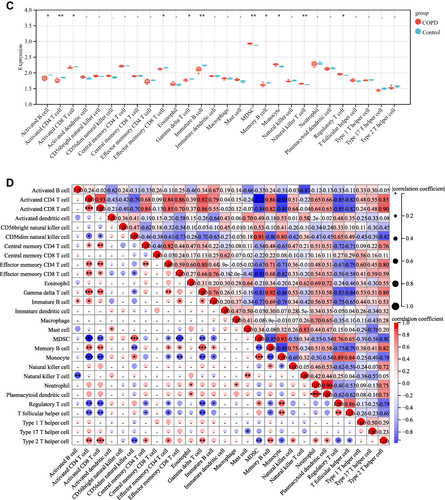
Figure 3 Screening and enrichment of the differential genes. (A) Screening of the differential genes in the combined dataset. (B) The different immune-related genes were obtained by the intersection of the screened differential genes and immune genes. (C) KEGG enrichment analysis was performed for differential immune genes. (D) GO enrichment analysis was performed on the different immune genes, including those involved in the regulation of the biological processes, cellular components, and molecular functions.
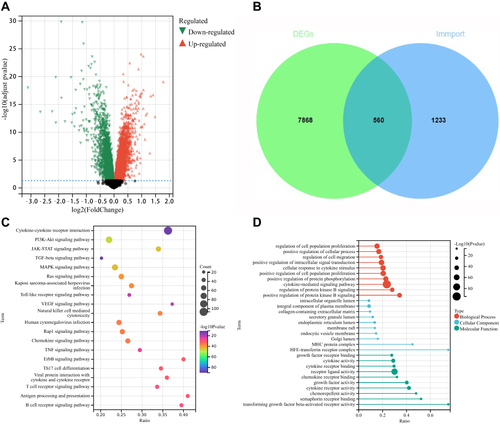
Figure 4 The differences in amplification and activation of MDSCs and immunosuppression-related molecules in COPD patients and healthy subjects. (A) The comparison of the expression of MDSCs amplified and pathologically activated signal molecules in airway tissues between COPD patients and healthy subjects. (*P<0.05,**P<0.01, ***P<0.001, ****P<0.0001). (B) The differential analysis of the immunosuppressive molecules of MDSCs in airway tissues between COPD patients and healthy subjects. (*P<0.05, ***P<0.001). (C) The comparison of the expression of MDSCs amplified and pathologically activated signal molecules in the peripheral blood between COPD patients and healthy subjects. (*P<0.05). (D) The differential analysis of the immunosuppressive molecules of MDSCs in the peripheral blood between COPD patients and healthy subjects. (*P<0.05, **P<0.01).
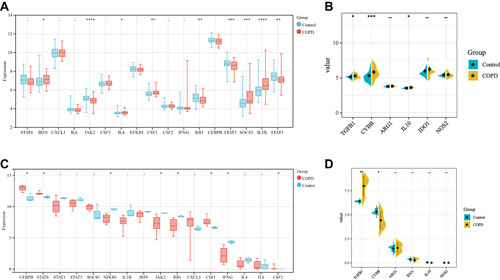
Figure 5 Analysis of the difference in immune checkpoint and its correlation with immune cells. (A) Analysis of the difference in immune checkpoint between COPD patients and healthy subjects. (*P<0.05, **P<0.01, ***P<0.001, ****P<0.0001). (B) Correlation analysis between immune checkpoints and immune cells.
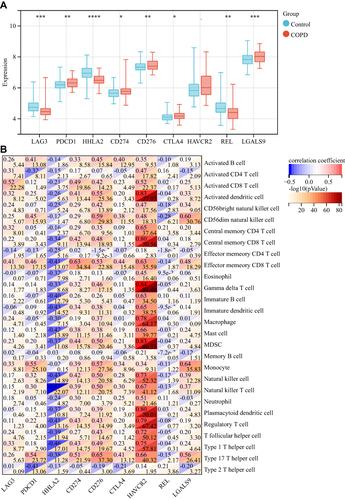
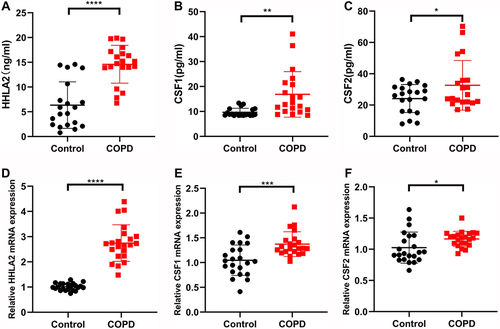
Figure 6 The detection of relevant differential protein by ELISA and mRNA by Real-Time PCR in peripheral blood (A) The detection of HHLA2 in the peripheral blood by ELISA. (****P<0.0001). (B) The detection of CSF1 in the peripheral blood by ELISA. (**P<0.01). (C) The detection of CSF2 in the peripheral blood by ELISA. (*P<0.05). (D) The detection of HHLA2 in the peripheral blood by Real-Time PCR. (****P<0.0001). (E) The detection of CSF1 in the peripheral blood by Real-Time PCR. (***P<0.001). (F) The detection of CSF2 in the peripheral blood by Real-Time PCR. (*P<0.05).