Figures & data
Figure 1 Flow diagram of the study design.
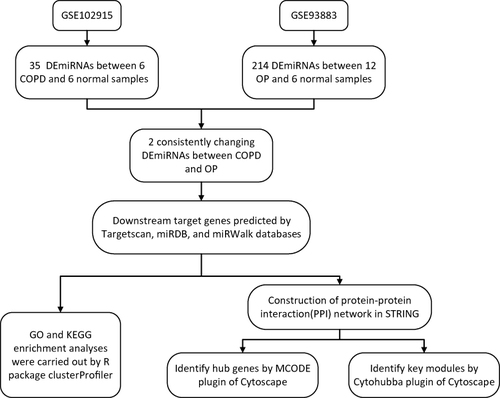
Table 1 Demographic and Baseline Characteristics of the Samples in the MicroRNA Array
Figure 2 Heatmaps and volcano plots of differentially expressed miRNA (|log2 fold change|>1, adjusted p-value<0.05). (A) Volcano plot of the GSE102915 dataset. (B) Volcano plot of the GSE93883 dataset. (C) Heatmap of the GSE102915 dataset. (D) Heatmap of the GSE93883 dataset. Red represents upregulated expression, blue means downregulated, and grey indicates no significant changes in volcano plot. Orange and blue in heatmaps represent patients and health control samples, respectively.
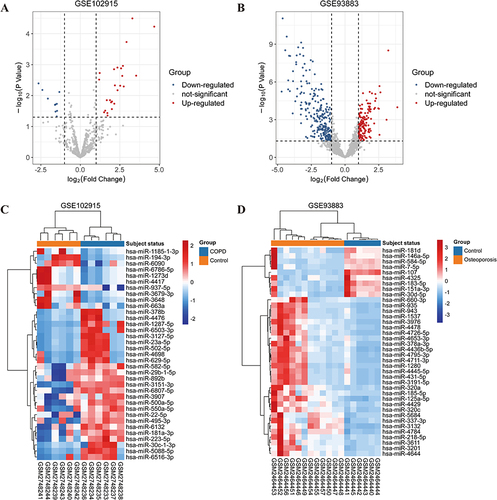
Table 2 Basic Information of Differentially Expressed miRNAs
Figure 3 Venn diagram of differences in miRNA expression of GSE102915 and GSE93883.
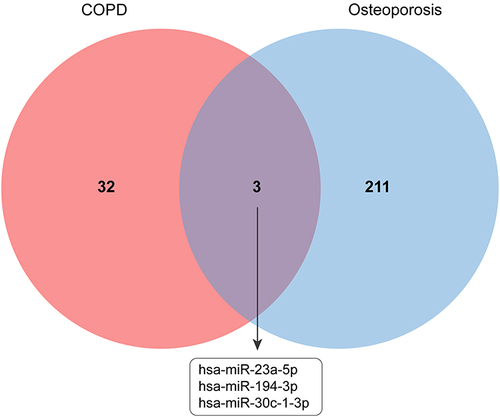
Figure 4 UpSet plot of target genes prediction.
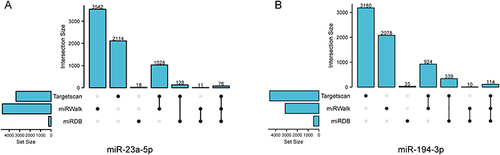
Figure 5 Prediction and regulatory network plots of target genes.
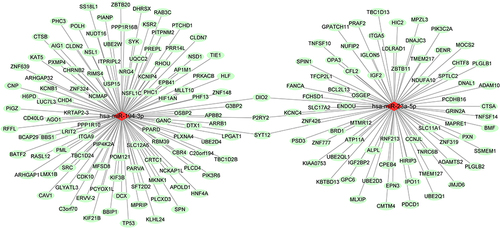
Figure 6 Results of GO term and KEGG pathways enrichment.
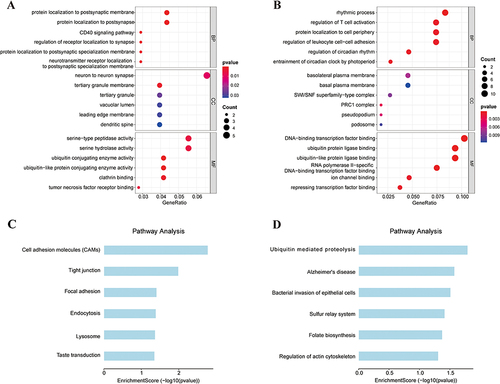
Figure 7 PPI interaction network established by the target genes. The grades of the colors represent the betweenness score. Lines indicate protein–protein interactions.
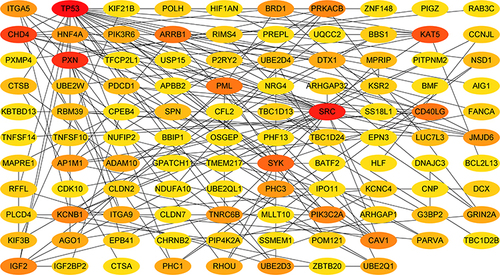
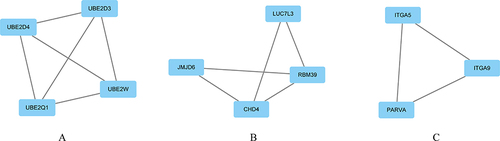
Figure 8 Screen results analyzed by the target genes based on the core network.