Figures & data
Figure 1 The effects of the drugs on RAW264.7 cell viability. (A and B) Cells were incubated with different concentrations of BML-111 and Jagged-1 for 24 h, and the effects of the drugs on the viability of RAW264.7 cells were detected by a CCK-8 assay. The values shown are the mean± SD; *p<0.05 vs the control group (0 μM).
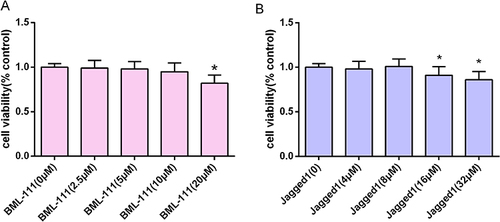
Figure 2 BML-111 reduced the expression of inflammatory mediators.(A–D) ELISAs illustrating the secretion levels of TNF-α, IL-1β, IL-18 and IL-10 protein at 24 h after macrophage exposure to CSE.Data are shown as the mean±SD. (n=6/**p<0.01 vs control group; #p<0.05, ##p<0.01 vs model group).
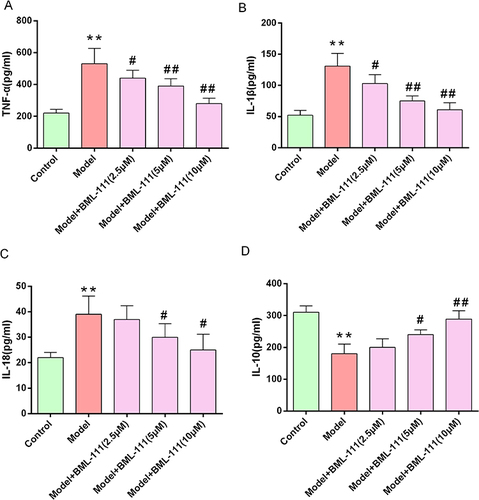
Figure 3 BML-111 inhibited CSE-induced NLRP3 inflammasome activation. (A) The protein expression levels of NLRP3, pro-caspase-1, and cleaved-caspase-1, observed using Western blot assay. (B and C) Semi-quantitative analysis of NLRP3 and cleaved-caspase-1/pro-caspase-1 ratio. The values shown are the mean±SD. (n=3/***p<0.01 vs Control group; ##p<0.01 vs model group).
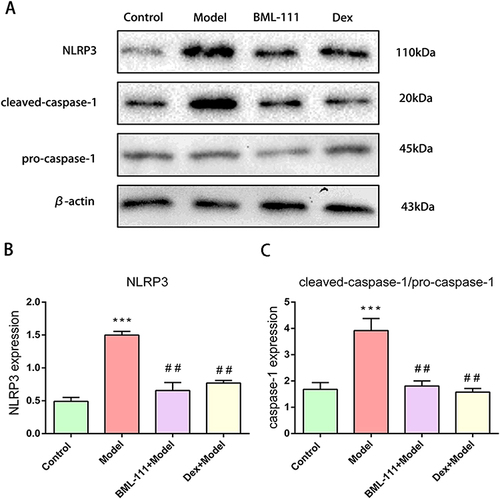
Figure 4 Effect of BML-111 on the expression of iNOS and Arg-1 after CSE stimulated mouse macrophages. (A and B) The transcription expression levels of iNOS and Arg-1, observed using RT-PCR assay by comparison with beta-actin; (C–E) The protein expression levels of iNOS and Arg-1, observed using Western blot assay by comparison with β-actin. Data are expressed as the mean±SD (n=3/*p<0.05, **p<0.01 vs control group; #p<0.05 ##p<0.01 vs model group; &p<0.05 vs BML-111 model group).
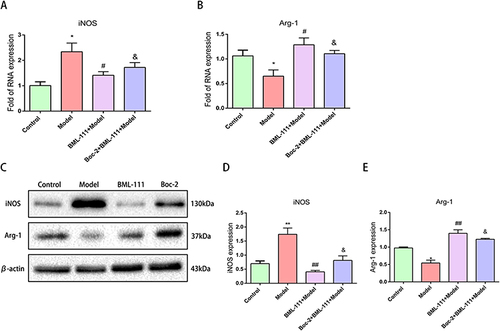
Figure 5 The effect of BML-111 on the expression of Notch-1, Hes-1 after CSE stimulated mouse macrophages. (A) The protein expression levels of Notch-1, activated Notch-1 and Hes-1, observed using Western blot assay by comparison with β-actin. (B and C) Semi-quantitative analysis of activated Notch-1/Notch-1, Hes-1 levels. Data are expressed as the mean±SD (n=3/ **p<0.01 vs control group; #p<0.05, ##p<0.01 vs model group).
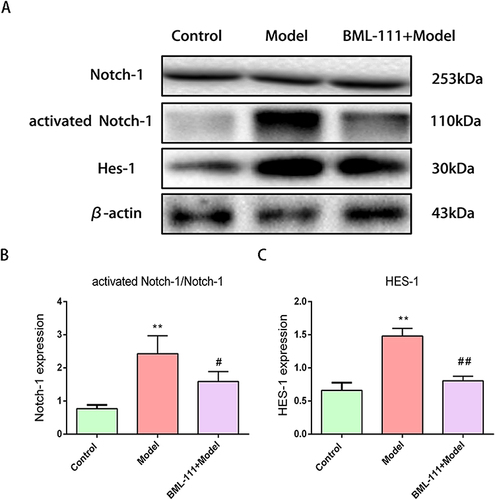
Figure 6 The expression of the Notch-1, iNOS, and Arg-1 after promoting the Notch signaling pathway with Jagged1 in macrophages following CSE treatment. (A) Western blot detection of Notch-1, iNOS, and Arg-1 in macrophages. (B–D) quantitative data on the expression of Notch signaling pathway related proteins Notch-1, the M1 marker iNOS and M2 marker Arg-1 in the cytosol and nucleus.The values shown are the mean±SD. (n = 3/*p<0.05, **p<0.01 vs control group; #p<0.05, ##p<0.01 vs model group; &p<0.05 vs the BML-111+Model group group).
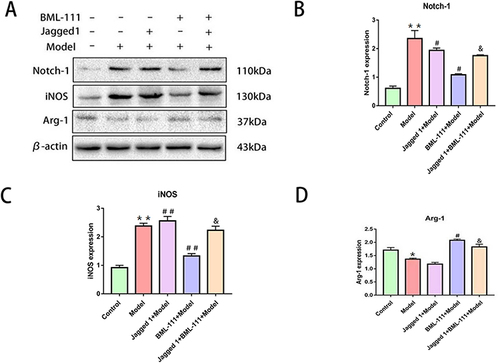
Figure 7 The expression of inflammatory cytokines after promoting the Notch signaling pathway with Jagged1 in macrophage supernatants following CSE treatment. (A–D) ELISA analysis of the secretion levels of inflammatory cytokines (TNF-α, IL-1β IL-18 and IL-10) in the supernatants. The values are shown as the mean±SD (n= 6/**p<0.01 vs control group; #p<0.05, ##p<0.01 vs model group; &p<0.05 vs the BML-111+Model group group).
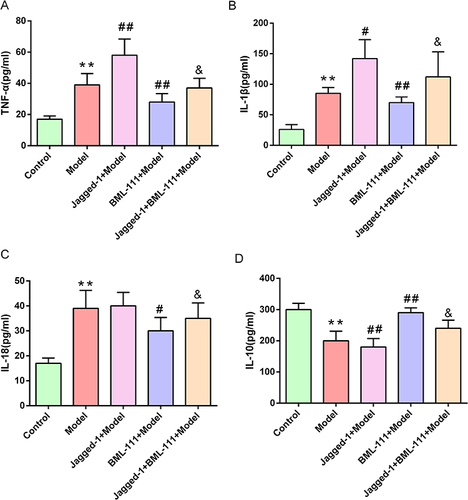
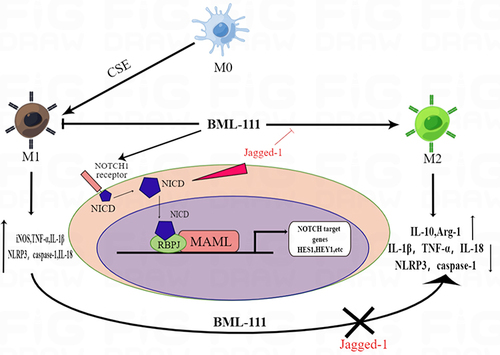
Figure 8 The mechanism of macrophage polarization and inflammation induced by BML-111 on RAW264.7 cells.