Figures & data
Figure 1 Flowchart of information through the different phases of this systematic review and meta-analysis.
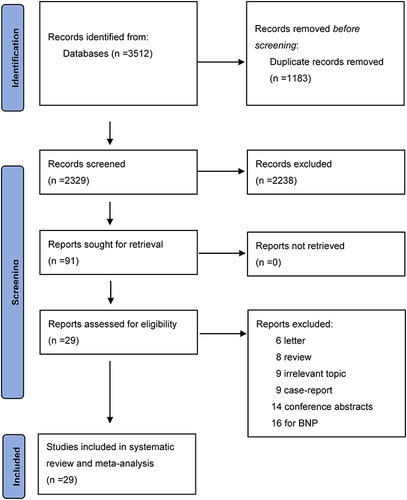
Figure 2 Forest plot of NT-proBNP level between COPD patients and Non-COPD patients.
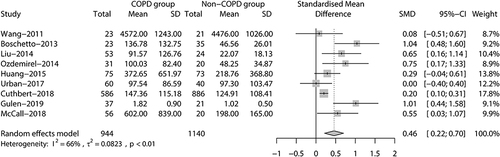
Figure 3 Forest plot of NT-proBNP level between COPD patients and Non-COPD patients subgroups.
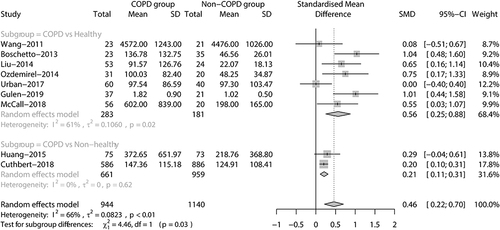
Figure 4 Sensitivity analysis plot of NT-proBNP level between COPD patients and Non-COPD patients.
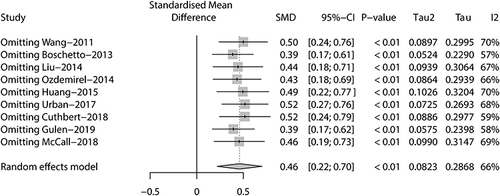
Figure 5 Forest plot of NT-proBNP level between stable COPD patients and healthy control.
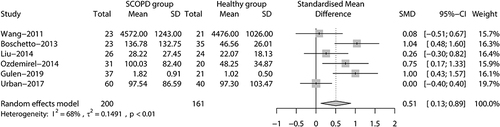
Figure 6 Sensitivity analysis plot of NT-proBNP level between COPD patients and healthy control.
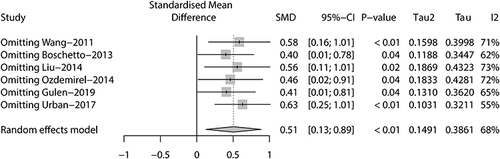
Figure 7 Forest plot of NT-proBNP level between stable COPD patients and AECOPD patients.
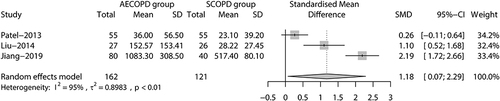
Figure 8 Sensitivity analysis plot of NT-proBNP level between stable COPD patients and AECOPD patients.
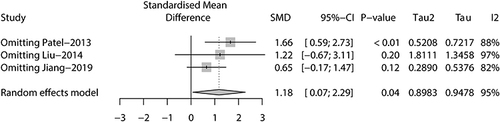
Figure 9 Forest plot of NT-proBNP level between Severe group and Non-severe group.
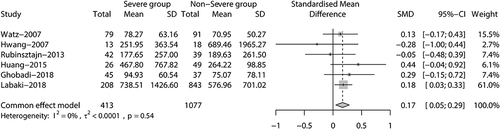
Figure 10 Forest plot of NT-proBNP level between Survivors and Non-survivors during hospitalisation.
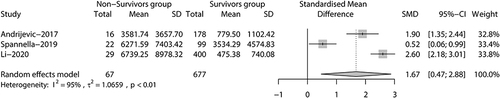
Figure 11 Sensitivity analysis plot of NT-proBNP level between Survivors and Non-survivors.
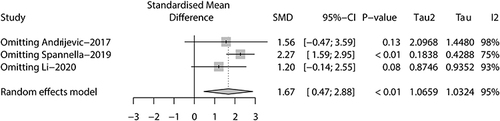
Figure 12 Forest plot of NT-proBNP level between COPD with CHF patients and COPD patients.
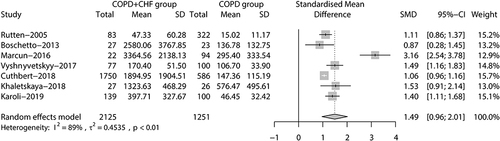
Figure 13 Sensitivity analysis plot of NT-proBNP level between COPD with CHF patients and COPD patients.
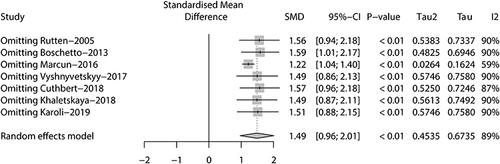
Figure 14 Forest plot of NT-proBNP level between CHF with COPD patients and CHF patients.
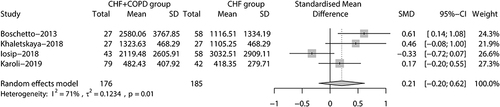
Figure 15 Sensitivity analysis plot of NT-proBNP level between CHF with COPD patients and CHF patients.
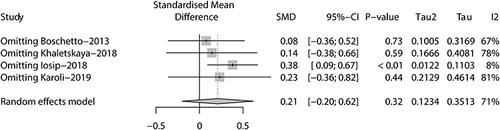
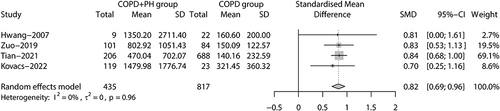
Figure 16 Forest plot of NT-proBNP level between COPD with PH patients and COPD patients.