Figures & data
Figure 1 PRISMA 2020 flow diagram for the identification of the studies included in the systematic review.
Notes: PRISMA figure adapted from Page MJ, McKenzie JE et al. The PRISMA 2020 statement: an updated guideline for reporting systematic reviews. BMJ. 2021;372:n71. Creative Commons.Citation25
Abbreviation: PRISMA, Preferred Reporting Items for Systematic Reviews and Meta-Analyses.
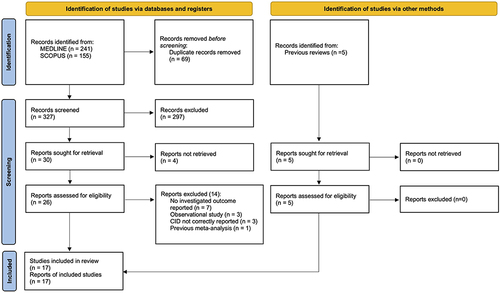
Table 1 Main Characteristics of the Studies Included in the Systematic Review and Meta-Regression Analysis
Table 2 Different CID Definitions Used in the Studies Included in the Systematic Review and Meta-Regression Analysis
Figure 2 Forest plot of meta-analysis concerning the impact of pharmacological treatment on the risk of CID in COPD.
Notes: The subgroup and overall effect estimates resulting from the meta-analysis are reported in bold; the red-dashed line indicates the average relative risk resulting for the overall effect estimate.
Abbreviations: AB, aclidinium bromide; BUD, budesonide; CID, clinically important deterioration; COPD, chronic obstructive pulmonary disease; FF, fluticasone furoate; FOR, formoterol fumarate; FP, fluticasone propionate; GLY, glycopyrronium bromide or glycopyrrolate; ICS, inhaled corticosteroid; IND, indacaterol; LABA, long-acting β2-adrenoceptor agonist; LABD, long-acting bronchodilators; LAMA, long-acting muscarinic antagonist; O, olodaterol; PCB, placebo; SAL, salmeterol; T, tiotropium bromide; UMEC, umeclidinium bromide; VI, vilanterol.
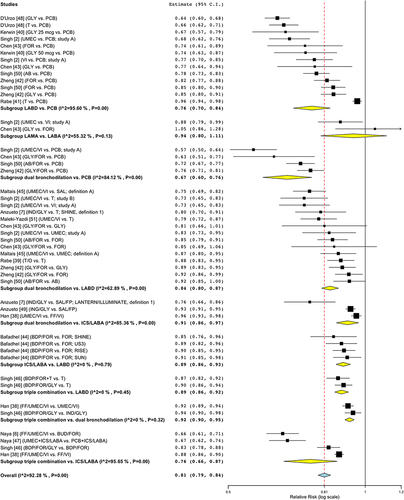
Figure 3 Graphical representation of the meta-regression analysis for age with respect to the risk of CID.
Note: The size of the circles is proportional to the sample weights.
Abbreviation: CID, clinically important deterioration.
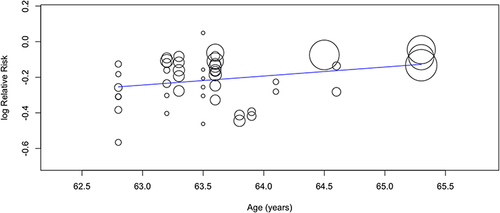
Figure 4 Funnel plot (A) and graphical representations of Egger’s test (B).
Notes: Funnel plot represents a visual approach to check for the existence of publication bias by assessing the symmetry of study distribution, whereas Egger’s test is a regression assay that permits to statistically quantify the extent of Funnel plot asymmetry; dotted lines in the Egger’s test represent 90% prediction bands.
Abbreviation: SND, standard normal deviate.
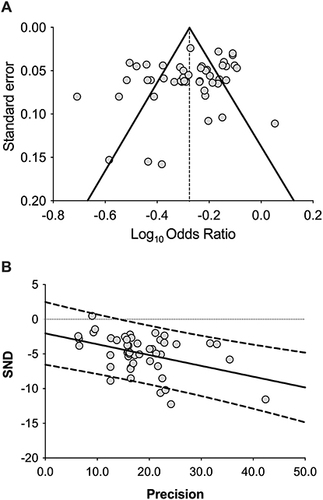
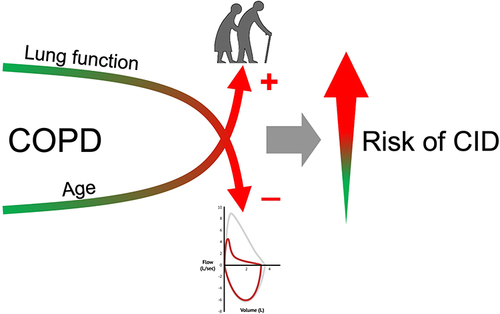
Figure 5 CID risk increases in older patients with worse lung function.
Notes: The meta-regression analysis suggested that age significantly modulates the risk of CID when associated with lower post-bronchodilator FEV1.
Abbreviation: CID, clinically important deterioration; COPD, chronic obstructive pulmonary disease; FEV1, forced expiratory volume in the first second.