Figures & data
Table 1 Sequence of Primers Were Used in This Study
Figure 1 PM2.5 exposure induced SIRT6 expression in macrophages. The expression of SIRT6 in lung tissues of mice was analyzed by RT-PCR (A) and Western blot (B). THP1 Cells were exposed to PM2.5 at indicated times or concentrations, SIRT6 expression was analyzed by RT-PCR and Western blot (C–E). BMDMs were exposed to PM2.5 at indicated times or concentrations, SIRT6 expression was analyzed by RT-PCR and Western blot (F–H). Data are presented as the mean ± SEM of three independent experiments. *P<0.05, **P<0.01, ***P<0.001, and ****P<0.0001.
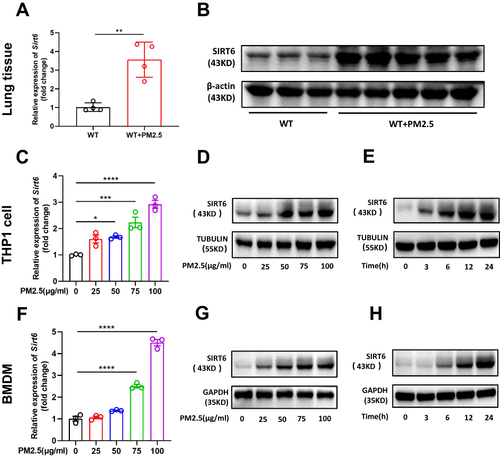
Figure 2 PM2.5 induced inflammatory cytokines production in macrophages. THP1 cells and BMDMs were treated with PM2.5 for 4 hours at indicated concentrations (25, 50, 75, 100μg/mL). The mRNA expression of Il-6, Tnf-α, Cxcl1, and Cxcl2 were increased in THP1 cells (A–D) and BMDMs (E–H) was analyzed by RT-PCR. Data are presented as the mean ± SEM of three independent experiments. *P<0.05, **P<0.01, ***P<0.001, and ****P<0.0001.
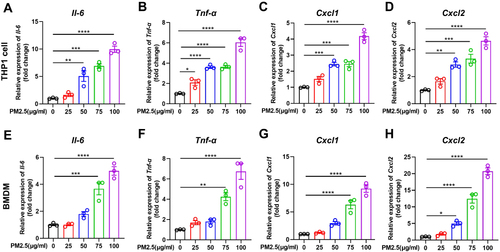
Figure 3 Knockdown of SIRT6 reduced PM2.5-induced inflammatory cytokines in THP1 cells. THP1 cells were transfected with control siRNA and Sirt6 siRNA for 24 h, and then were treated with PM2.5 at 100 μg/mL for 4 h. SIRT6 expression was measured using Western blot (A) and RT-PCR (B). The mRNA expression of Il6, Tnf-α, Cxcl1, and Cxcl2 in THP1 cells were determined using RT-PCR (C–F). Data are presented as the mean ± SEM of three independent experiments. **P<0.01, ***P<0.001, and ****P<0.0001.
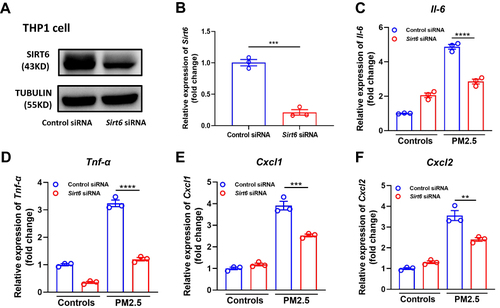
Figure 4 Sirt1-deficient BMDMs attenuated PM2.5-induced inflammatory cytokines. Genotyping was assessed in BMDMs from Sirt6fl/fl and Sirt6fl/fl-LysMCre mice using Western blot (A) and RT-PCR analysis (B). BMDMs were treated with PM2.5 at 100 μg/mL for 4 h to measure the levels of Il6, Tnf-α, Cxcl1, and Cxcl2 using RT-PCR (C–F). Data are presented as the mean ± SEM of three independent experiments. ***P<0.001 and ****P<0.0001.
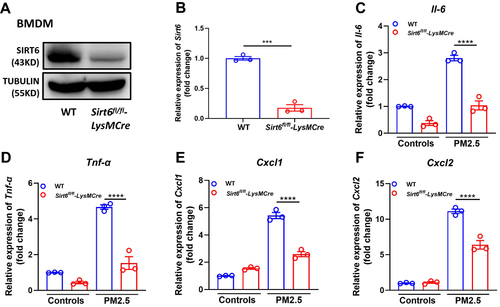
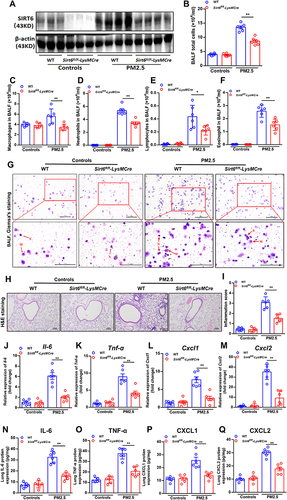
Figure 5 Conditional knockout of SIRT6 in macrophages attenuated PM2.5-induced inflammatory responses in mice. The expression of SIRT6 in the lung tissue was assessed by Western blot (A). The number of total cells (B), macrophage (C), neutrophil (D), lymphocytes (E) and eosinophil (F) in the BALF were measured by Flow cytometry. Representative images of macrophages and neutrophils in the BALF were analyzed using Giemsa’s staining (G, Scale bar: 100 μm). Representative images of lung sections with hematoxylin and eosin (H&E) staining (H, Scale bar: 100 μm). Semi quantification of inflammation expression in the lungs were performed using Image Pro 6.1 software (I). Il6, Tnf-α, Cxcl1 and Cxcl2 mRNA expression in lung homogenate were measured by QPCR (J–M). Protein concentrations of cytokines above in lung homogenate were measured by ELISA (N–Q). Data are presented as Mean ± SEM of three independent experiments (n=6 for each group). *P<0.05 and **P<0.01.