Figures & data
Figure 1 Flow diagram of the study.
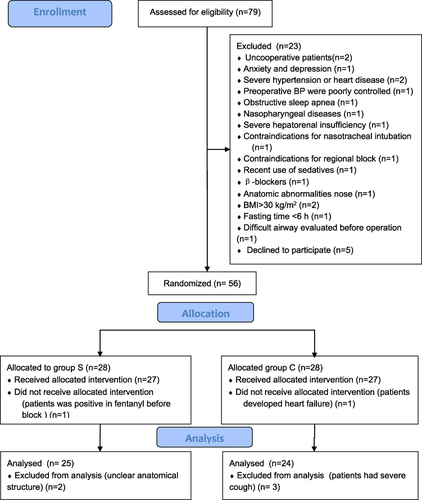
Figure 2 The view of ultrasound-guided superior laryngeal nerve block. Hyoid bone, 1; thyroid cartilage, 2; thyrohyoid muscle, 3; thyrohyoid membrane, 4; superior laryngeal nerve, 5; the arrow denotes the puncture path of the needle.
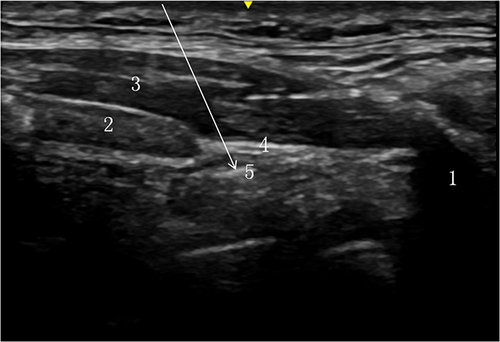
Table 1 Patient and Procedure Characteristics in the Two Groups
Table 2 Time for Intubation, Comfort Score and Incidence of Adverse Reactions in the Two Groups
Figure 3 Comparison of the time for intubation (A), the incidence of adverse reactions (B) and the comfort score (C). (A and C) The data are expressed as the mean ± standard deviation compared with group C. The data were compared with an independent sample t-test; *P<0.01. (B) The data are expressed as the percentage, compared with group C. Data were compared with Fisher’s exact test; *P<0.01. Group S received ultrasound-guided superior laryngeal nerve block; group C was the control group.
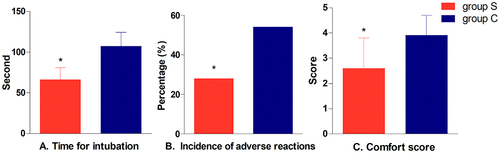
Figure 4 Comparison of the mean arterial pressure (MAP) (A) and heart rate (HR) (B) between the groups immediately before intubation (T0); immediately after intubation to the laryngopharynx (T1); and immediately (T2), 5 min (T3) and 10 min (T4) after intubation (25 patients in group S and 24 patients in group (C). The data are expressed as mean ± standard deviation. #Based on analysis of variance (ANOVA), compared with T0, MAP and HR in group C was significantly higher at T1, T2, T3 and T4 (P<0.05). *Based on one-way ANOVA, MAP and HR in group S was significantly lower than in group C at T1, T2, T3 and T4 (P<0.05), whereas they were not significantly higher in group S(P>0.05). Based on one-way ANOVA, there was no significant difference in MAP and HR between groups at T0 (baseline) (P>0.05). Group S received ultrasound-guided superior laryngeal nerve block; group C was the control group.
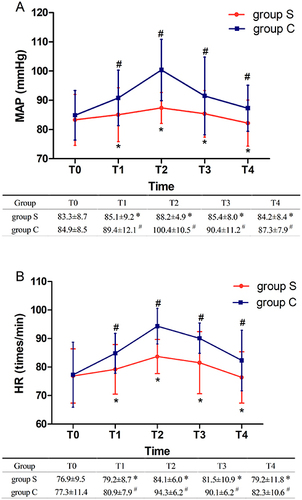
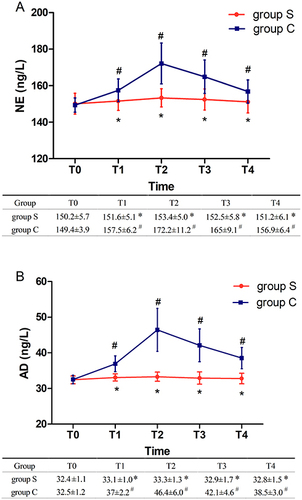
Figure 5 Comparison of the norepinephrine (NE) (A) and Adrenaline (AD) (B) concentrations between the groups immediately before intubation (T0); immediately after intubation to the laryngopharynx (T1); and immediately (T2), 5 min (T3) and 10 min (T4) after intubation (25 patients in group S and 24 patients in group (C). The data are expressed as mean ± standard deviation. #Based on analysis of variance(ANOVA) compared with T0, NE and AD in group C was significantly higher at T1, T2, T3 and T4 (P<0.05), but not significantly higher in group S (P>0.05). *Based on one-way ANOVA, NE and AD in group S was significantly lower than in group C at T1, T2, T3 and T4 (P<0.05). Based on one-way ANOVA, there was no significant difference in NE and AD between groups at T0 (baseline) (P>0.05). Group S received ultrasound-guided superior laryngeal nerve block; group C was the control group.