Figures & data
Table 1 Comparison of Clinical Characteristics Between Death Group and Survival Group Within 90 Days After Discharge
Table 2 Multivariate Regression Analysis of Risk Factors for Mortality Within 90 Days in Patients with AECOPD
Figure 1 The ROC curves of the different biomarkers and the logistic model for predicting the risk of mortality within 90 days in patients with AECOPD. The logistic model including 4 variables of age≥72 years, NLR>14.17, EOS<0.15% and BNP>2840ng/L had the highest AUC, followed by NLR.
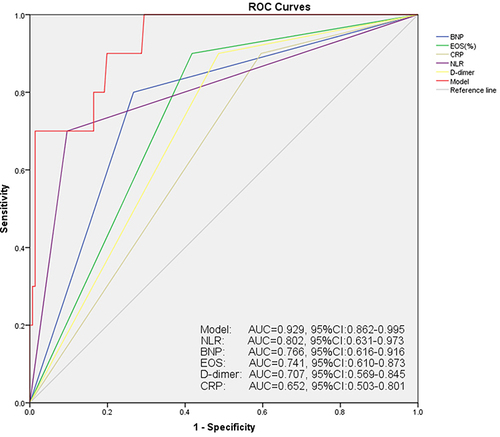
Figure 2 The ROC curves of the different biomarkers for predicting the risk of (A) re-exacerbation and (B) readmission within 90 days in patients with AECOPD.
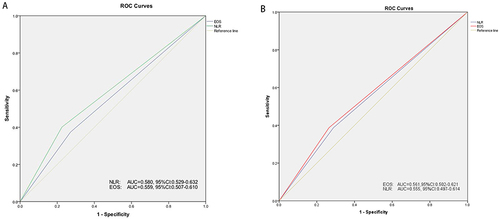
Table 3 Comparison of Clinical Characteristics Between High NLR Group and Low NLR Group at Admission
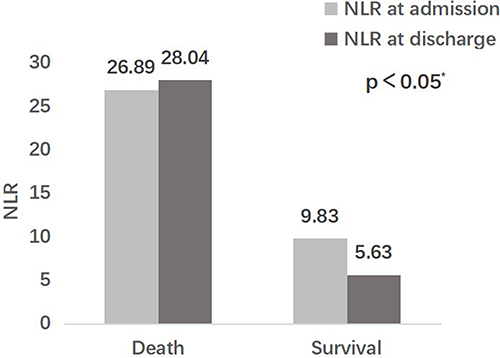
Figure 3 Comparison of changes in NLR at admission and discharge between the death and survival groups within 90 days after discharge. *: The levels of NLR at admission and NLR at discharge or death were statistically different between the two groups (p<0.05).