Figures & data
Table 1 Comparison of Clinical and Demographic Characteristics of Patients with COPD and Healthy Controls
Figure 1 Flow chart of COPD patient recruitment.
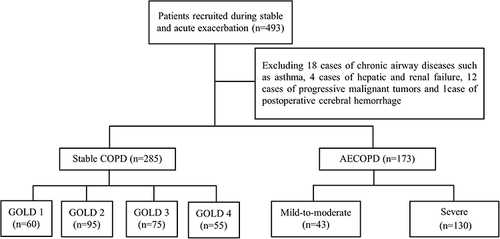
Figure 2 Plasma PTX3 levels of AECOPD, stable COPD and healthy controls. ****P < 0.0001; ns, P > 0.05.
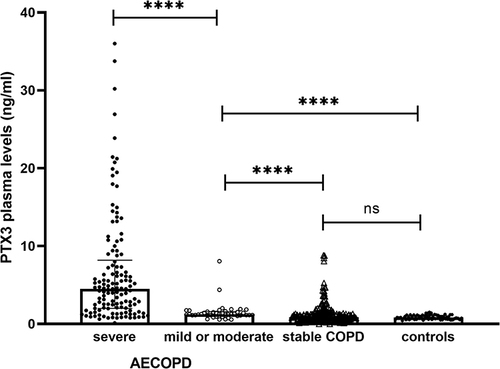
Figure 3 Plasma PTX3 levels of patients with respiratory failure and without respiratory failure in severe AECOPD subgroup. ****P < 0.0001.
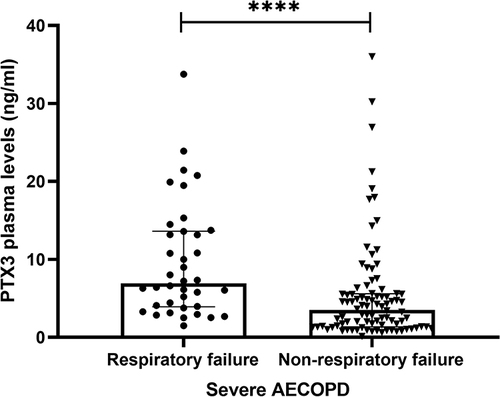
Table 2 Baseline Characteristics and Plasma PTX3 Level of Patients with AECOPD and Stable COPD After PSM
Table 3 Spearman Correlation Analysis Between Plasma PTX3 (r1, P1), GOLD Stage (r2, P2) and CAT Scores, mMRC, FEV1%pred in Patients with Stable COPD
Table 4 Clinical and Laboratory Parameters of Severe AECOPD Patients
Figure 4 Correlations between plasma PTX3 and clinical parameters. The number in each line in the heat map indicated the correlation coefficient. The red cells showed positive correlations and the blue cells showed negative correlations. *P < 0.05; **P < 0.01; ***P < 0.001; ****P < 0.0001.
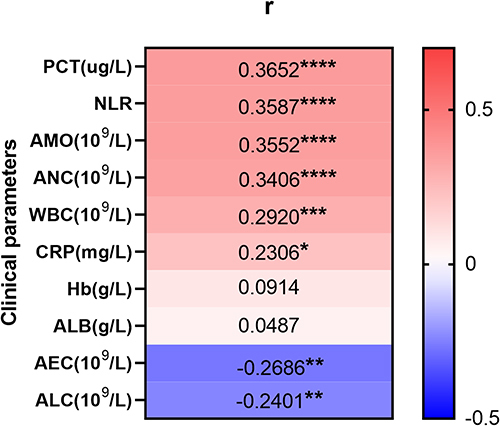
Table 5 Cut-Off Value, AUC, Sensitivity and Specificity of Plasma PTX3 for AECOPD
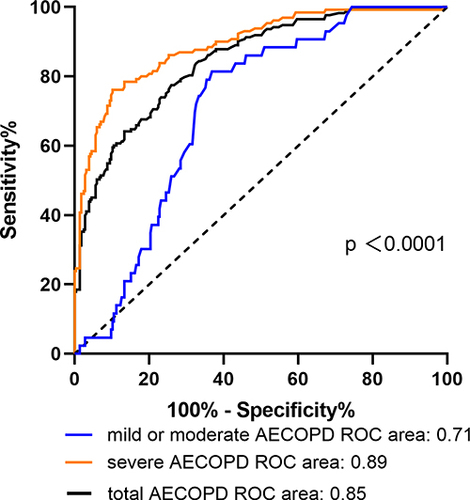
Figure 5 ROC curves of diagnostic value of plasma PTX3 for AECOPD, mild or moderate AECOPD and severe AECOPD.
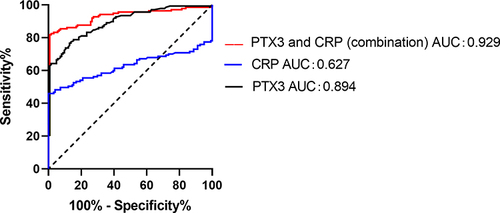
Figure 6 ROC curves of diagnostic value of plasma PTX3, CRP and combination of PTX3 with CRP for AECOPD.