Figures & data
Figure 1 The airway microbiome composition of COPD patients changed with months. (a) Principal component analysis (PCA) of microbiome grouped by sampling months (b). Microbiome composition at genus level in different months. (c) Alpha diversity (Shannon) of airway microbiome in different months. (d) Microbiome with significantly changed relative abundance in different months (P < 0.05). Kruskal–Wallis rank sum test was used to test differences of OTUs in different months.
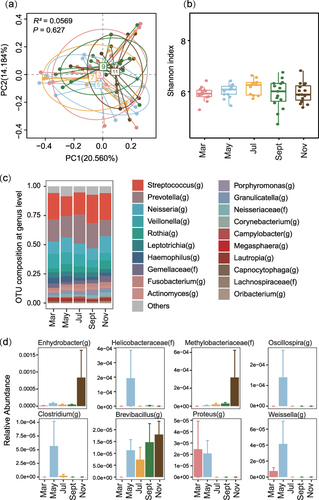
Figure 2 Differential and clustering analysis of the airway microbial relative abundance along the time course. Line charts represent the trends of z-score of the relative abundance of OTUs over time. The top five most abundant OTUs were listed on the right side of each plot. Full members of each cluster were listed in Table S2. Colors indicate membership values representing the degree to which data points belong to a cluster.
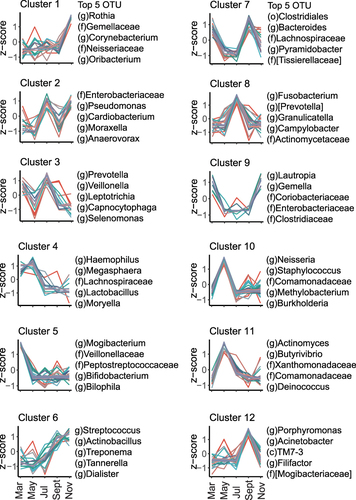
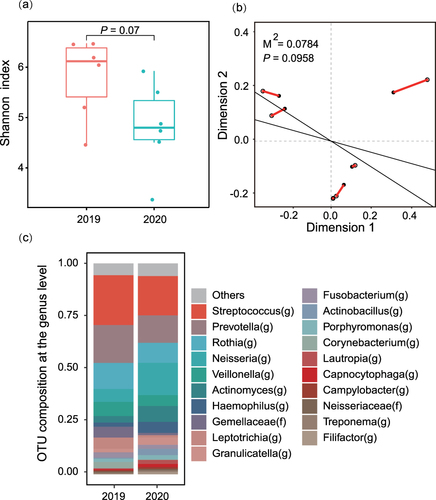
Figure 3 Microbial profiles from the same patients sampled in the same season of different years. (a) Alpha diversity (Shannon). (b) Procrustes analysis of the airway microbiome profiles from the same patients sampled in different years. Solid dots indicate samples from the year 2019 and circles indicate samples from 2020. (c) Microbiome composition at the genus level.